Cybersecurity Metrics in 2026: Link Control Evidence to Better Risk Decisions
Useful cybersecurity metrics show where material exposure remains, who needs to act and whether corrective work reduced the risk. Learn how to define populations, keep exceptions visible and connect control evidence to decisions leaders can defend.
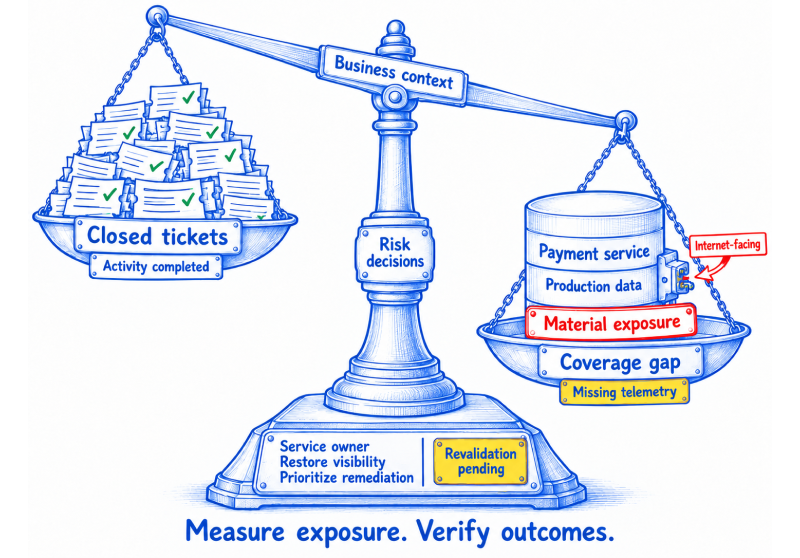
A cybersecurity metrics dashboard can look reassuring and still leave a CISO unable to answer the question that matters: where are we materially exposed right now? Green charts often measure completed activity, such as tickets closed or patches deployed. They may not show whether all critical assets were in scope, whether the control operated as intended, or whether a high-risk exception remains.
The better purpose of cybersecurity metrics is not to produce a score. It is to help a leadership team decide where to intervene, what risk to accept, and whether a completed action actually restored the expected security condition. That requires measures with a defined population, a business context, an accountable owner, and a route from failure to verified outcome.
Why many cybersecurity metrics fail in executive review
Most security teams have no shortage of data: exposure findings, detection alerts, patch reports, identity records, supplier questionnaires, audit evidence, and tickets. The problem is that the numbers often describe different populations and are reviewed without a decision in mind.
Consider a metric that says 98% of critical vulnerabilities were remediated within the target. It sounds strong, but it is incomplete until leaders can see the denominator: Which assets were included? Were internet-facing systems included? How many remaining vulnerabilities are known to be exploited, attached to critical services, or covered by an approved exception? A high percentage can coexist with an unacceptable residual risk.
The same issue applies to MTTD and MTTR. They can be useful, but an enterprise average can hide a slow response to an identity compromise or a critical service. Measure severity bands and pair speed with quality: Was the incident contained, the root condition corrected, and recurrence prevented?
Cybersecurity metrics flow from operational signals through control scope and business context to an accountable decision and verified outcome.
Start with the decision, not the dashboard
Before selecting a metric, write down the decision it should support. For each measure, ask five questions:
What decision changes if this number moves?
What exact population is included, and what is deliberately excluded?
Which control or operational condition is being tested?
Who owns the response when the threshold is missed?
What evidence will prove that corrective action worked?
This is a practical metric contract. It prevents a dashboard from becoming a collection of numbers that nobody can challenge or act on. It also helps teams distinguish a KPI from a KRI. A key performance indicator (KPI) tracks whether a process or control is achieving its target. A key risk indicator (KRI) signals increasing exposure or an approaching tolerance limit. One measure can inform both, but the decision and threshold should be explicit.
Five cybersecurity metric families that hold up under scrutiny
The most useful set varies by organization. Select the few that reveal whether important services are protected and failures are being resolved.
1. Coverage and scope certainty
Coverage measures answer whether a control reaches the population it is supposed to protect. They are the foundation for every percentage that follows.
Examples include critical assets with a named owner and current telemetry, privileged accounts covered by phishing-resistant authentication, and in-scope cloud workloads assessed against the required baseline. Report the uncovered population separately. “96% covered” needs to name the 4% that are not and the services affected.
2. Exploitable exposure and remediation quality
Vulnerability counts alone create noise. Prioritize where exploitation evidence, exposure, asset criticality, privilege, and age point in the same direction. CISA maintains its Known Exploited Vulnerabilities Catalog as an authoritative prioritization input. A stronger leadership measure is “prioritized vulnerabilities on in-scope critical services, grouped by age and remediation state.”
Pair closure speed with validation. Track the percentage of prioritized findings remediated within target, then verify that the affected asset is no longer vulnerable or that the compensating control is operating. A closed ticket is not proof of reduced exposure.
3. Identity and control effectiveness
Identity metrics should show whether access controls are complete and working, not merely whether a review was scheduled. Examples include privileged accounts onboarded to PAM, high-risk access reviews completed, dormant privileged accounts awaiting disposition, and administrator authentication coverage.
For each, show the expected condition and the exception path. If a system cannot meet the standard, record the compensating control, accountable risk owner, approval period, and next review date. This turns an exception register into a measurable risk decision rather than a hidden exclusion.
4. Detection, containment, and recovery
Segment detection and containment time by incident type, criticality, and affected service. Add cases that breached the response objective, with the cause: missing telemetry, delayed triage, unavailable owner, weak playbook, or dependency failure.
Recovery deserves its own evidence. A backup success rate is not proof that a critical service can be restored within its objective. Track restore tests, results, gaps, and revalidation dates.
5. Third-party and exception governance
Supplier completion rates are a poor proxy for third-party security. Measure critical suppliers with a current risk decision, material issues, overdue evidence, or untested continuity dependencies. For internal exceptions, count active material cases by service and expiry date, not simply total approvals.
Visual: Five cybersecurity metric families linked to the risk and investment decisions they support.
Use leading indicators alongside outcomes
Lagging indicators show what happened: a material incident, missed recovery objective, or audit finding. Leading indicators show conditions that make a future failure more likely, such as critical assets without telemetry, expiring exceptions, overdue remediation, or privileged accounts outside required controls.
Do not label a measure “leading” simply because it updates daily. It is leading only if it has a plausible, testable connection to an outcome the organization wants to avoid. Retire or redesign it if it does not predict that outcome.
Make every metric traceable to a control and action
An illustrative scenario makes the difference clear. A company reports that 95% of critical patches were applied within 14 days. During a review, the remaining 5% is found to contain internet-facing systems supporting payment processing. Several were excluded because their agents were not reporting. The headline KPI remains green, but the actual issue is a coverage failure followed by a remediation priority failure.
A stronger metric contract would show the asset population, verified telemetry, prioritized backlog, exceptions with expiry dates, owners, and proof that remediation removed the condition. It changes the decision from “celebrate patch speed” to “restore visibility and reduce concentrated exposure.”
Turn cybersecurity metrics into a management routine
Begin with one critical service or control family, not a full enterprise dashboard. Define the expected condition and population, connect the relevant operational sources, and review early results with the service, control, and risk owners. Resolve denominator disputes before debating targets.
Then establish a rhythm. Operational teams may need daily or weekly views; control owners may review coverage, evidence freshness, and exceptions monthly. Senior leadership should receive material movement, breached tolerances, decisions required, and verified outcomes. Each review should produce an action, owner, deadline, and revalidation step.
This is where connected governance matters. SPOG.AI’s continuous control monitoring is designed to connect defined controls with live operational evidence, ownership, and remediation workflows. Its GRC capabilities help teams relate control gaps and exceptions to the enterprise context needed for prioritization. The value is not a bigger dashboard. It is a current, traceable route from a control signal to an accountable decision.
Conclusion
Good cybersecurity metrics are decision instruments. They make it possible to see whether a control covers the population it should, where material exposure remains, who must act, and whether the action changed the condition. Start small, define the denominator, and make closure verifiable. When the numbers can withstand those questions, they become useful to security operators, risk owners, and the board alike.
Frequently asked questions
Cybersecurity metrics are measurable indicators used to assess security control coverage, performance, exposure, and the outcome of corrective actions.
A KPI shows progress or performance against a target. A KRI signals rising exposure or proximity to a risk tolerance limit.
Report material exposure, control coverage gaps, response and recovery outcomes, major exceptions, and decisions or investment required. Include the affected business context.
Every percentage depends on its denominator. If assets or identities are missing from scope, a positive metric can hide the systems with the greatest exposure.
Yes, when segmented by severity and incident type and paired with containment quality. A single enterprise average can be misleading.
Measure prioritized vulnerabilities by exploitation evidence, exposure, criticality, age, owner, and verified remediation status, not only by total vulnerability count.
It has a defined population, a target or tolerance, a named owner, a decision path, and evidence that corrective action worked.
Match the review cycle to the decision. Operational measures may be daily or weekly; risk and governance metrics are often reviewed monthly or quarterly.
Yes. Show their scope, business criticality, owner, approval expiry, compensating control, and review status so exceptions remain visible risk decisions.
It can connect control expectations with current operational evidence, reveal changes in coverage or control state, and support accountable remediation and revalidation.
Technology writer and content strategist with 5+ years of experience, including work for a US-based B2B SaaS client and a cybersecurity solution. I create cybersecurity and GRC content, product documentation, and user guides that help technical teams and business leaders understand security capabilities and workflows. Currently working on Confluence documentations on vulnerability management, ITSM, incident management, and continuous control monitoring, alongside SEO and AEO content, and technology partner database development.