Cyber Risk Calculation Methods: Match the Output to the Decision
Different risk decisions need different outputs. Compare qualitative assessments, priority scores and quantitative loss estimates, and learn how to choose a method that makes assumptions, evidence and uncertainty clear to the people deciding what happens next.
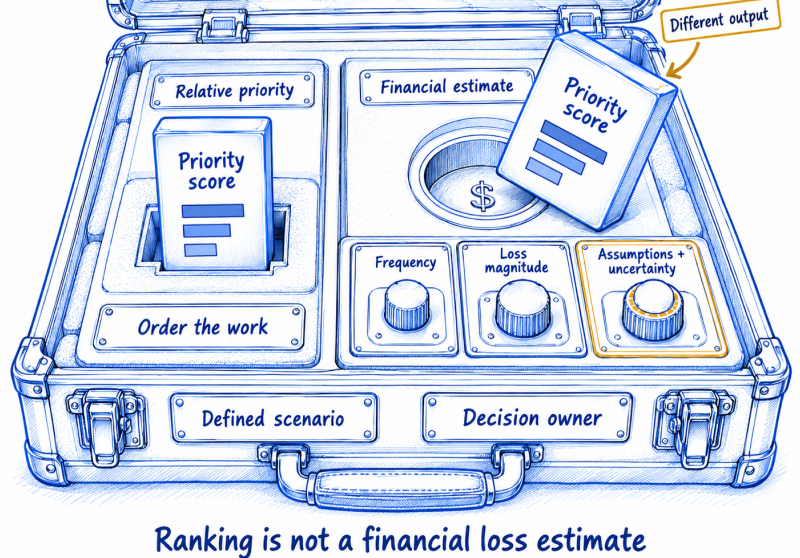
Cyber risk calculation methods should help a decision owner choose an action. Yet the same score is often expected to prioritize vulnerabilities, approve temporary exceptions and justify security investment. They require different outputs. A ranking can identify what deserves attention without establishing how much financial loss an investment might avoid.
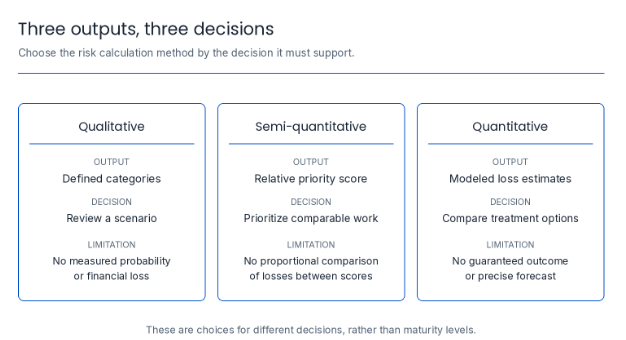
The practical choice is between qualitative assessment, semi-quantitative scoring and quantitative analysis. Start with the decision, define a loss scenario, then choose an output whose meaning and limitations are clear.
Define the loss scenario before choosing a method
“Cloud risk” is a topic, not a defined scenario. Identify the affected service, initiating event, route to harm, consequences, assessment period and controls being considered. This gives analysts a specific scenario to estimate and decision owners a basis for challenge.
For example, assess whether unauthorized changes to a recovery environment could prevent restoration of a customer-facing service during the next year. Separate interruption costs from investigation and restoration costs. Specify which dependencies are included and who supplies the business-impact assumptions.
NIST’s December 2025 revision of IR 8286A connects scenario documentation, likelihood and impact estimates with cybersecurity risk registers and enterprise risk management. For practitioners, the implication is that a score should remain attached to its scenario and evidence as it moves into leadership reporting.
Write the decision alongside the scenario: immediate containment, sequencing remediation, approving treatment or comparing investment options. That decision determines how much analysis is justified.
Compare cyber risk calculation methods by their outputs
Approach
What the output means
Suitable decision
What it does not establish
Qualitative risk assessment
Defined categories with an evidence-based explanation
Initial assessment or urgent review
A measured probability or financial loss
Semi-quantitative risk assessment
Relative priority under documented scoring rules
Ordering comparable work
A ratio of losses between scores
Quantitative risk analysis
Estimated frequency, loss magnitude and uncertainty
Comparing consequential treatment options
A guaranteed outcome or precise forecast
These approaches need not represent successive maturity levels. Select them by usefulness, rather than requiring every scenario to pass through all three. An urgent containment decision should not wait for a financial model.
The comparison prevents a common reporting mistake: giving a local score a financial meaning that its inputs never supported.
Use qualitative assessment to make judgement explicit
A qualitative risk assessment uses defined descriptions of likelihood and consequence. Expert interviews and scenario workshops can contribute, but the result needs a rationale that another reviewer can examine.
For the recovery scenario, ask the service owner about disruption consequences and the technical team about administrative access, change controls and restore tests. Record where their evidence supports the assessment and where they disagree.
Give each category an operational meaning. Define “major consequence” using the service’s approved disruption tolerances and business-impact criteria, rather than an analyst’s personal understanding of “major.” State the period over which likelihood is considered.
Missing evidence should remain visible. An untested recovery dependency does not justify a reassuring label simply because no failure has been observed. Route the uncertainty to investigation and specify whether an interim decision is needed.
Use semi-quantitative scoring as a local ordering rule
Semi-quantitative risk scoring assigns representative numbers to categories or combines factors into a priority index. A likelihood-impact risk matrix is one familiar implementation. Its reliability depends on the category definitions and combination rules.
Consider an illustrative five-level scale. Scenario A receives likelihood 2 and impact 5, producing 10. Scenario B receives 3 and 3, producing 9. If the same ordered categories are relabeled 1, 2, 4, 5 and 6, A produces 12 while B produces 16. The ordering reverses without changing the underlying judgements.
This arithmetic example shows why multiplying ordinal labels requires caution. The spacing was a design choice, not measured distance. A score of 20 cannot establish twice the loss of a score of 10.
Pilot the rule against known cases before using it for work allocation. Document tie-breaking, escalation and overrides. Preserve the individual factors so reviewers can challenge the ranking. Avoid adding vulnerability severity, business criticality and control weakness without checking for overlapping inputs and inconsistent scales.
Use quantitative analysis when loss estimates can change a decision
Quantitative cyber risk analysis estimates quantities with interpretable units, such as loss events per year and monetary loss per event. Factor Analysis of Information Risk (FAIR) structures analysis around loss event frequency and loss magnitude, with uncertainty represented in inputs and outputs.
For a simplified model in which average loss per event is independent of annual event count:
Expected annual loss = expected events per year × average loss per event.
An illustrative estimate of 0.2 events per year and ₹50 lakh average loss per event yields ₹10 lakh expected annual loss. This is neither a predicted annual bill nor a statement that an event has exactly a 20% annual probability. Some years may have no event; others may have larger or repeated losses.
Use ranges or distributions when the inputs are uncertain. Monte Carlo simulation samples the chosen input distributions repeatedly to explore modeled outcomes. It does not validate those assumptions or discover missing dependencies.
Report more than the mean when severe outcomes matter. Explain the modeled chance of exceeding a relevant loss threshold, key assumptions and sensitivity to uncertain inputs. Identify which additional evidence could materially change the treatment decision.
An illustrative recovery investment decision
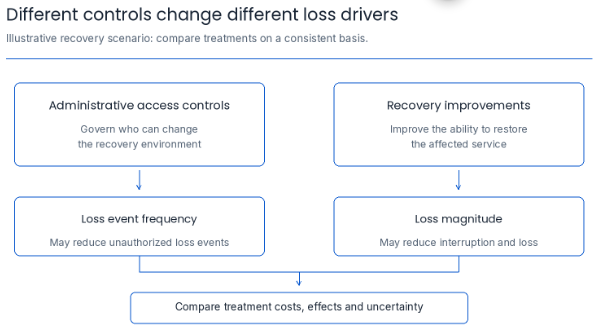
A fictional service team compares stronger administrative access controls with improved recovery capability. Both address the same loss scenario, but through different mechanisms.
Access controls may reduce the likelihood of unauthorized changes. Recovery improvements may reduce interruption duration and loss magnitude. The analysis should state those causal assumptions and the evidence required to support each.
Hold the scenario, currency and assessment period constant when comparing options. Include implementation and operating costs, transition exposure and dependencies. Consider combined treatment without assuming the benefits add independently.
If the preferred option changes when a plausible recovery-duration estimate changes, investigate that estimate before approving the investment. If the choice remains useful across credible assumptions, document why the uncertainty does not prevent action.
The useful result is an explainable treatment choice, supported by assumptions that can be tested after implementation.
Keep severity and control evidence in their proper roles
The Common Vulnerability Scoring System (CVSS) communicates vulnerability severity. FIRST’s current v4.0 user guide explicitly warns against using the Base score alone to assess risk. Threat and Environmental metrics provide context, but a severity score does not establish an institution’s financial exposure.
Control evidence should also inform a specific causal claim. A restore test can inform recovery-duration assumptions for the tested service. It does not automatically reduce the probability of initial compromise. Access-review completion does not, by itself, demonstrate that every relevant entitlement was reviewed.
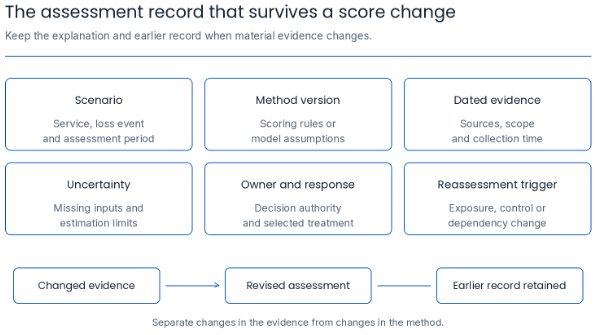
Continuous control monitoring can help identify changes in connected control evidence. Reassess the affected assumption when exposure, access or recovery conditions change. Retain the previous assessment so a reviewer can distinguish changed conditions from changed scoring rules.
Govern the method and the resulting decision
Record the scenario owner, method version, input sources, assessment date, uncertainty, selected response and reassessment triggers. Require material overrides to preserve the original result and explain the decision authority and rationale.
Keep inherent and residual risk comparisons on a consistent basis. Define the control assumptions behind the inherent baseline and assess residual risk using evidence of implemented controls. A planned treatment is a proposed future state until its effectiveness is verified.
A phased GRC implementation can establish this ownership and evidence routine. SPOG.AI’s published positioning connects cyber risk, control validation, compliance evidence and operational workflows. These capabilities support decision context; they do not establish that SPOG.AI implements FAIR or a particular financial simulation model.
Visual: Cyber risk calculation assessment record preserving assumptions, evidence, ownership and reassessment history.
Put the method to work
Choose one consequential scenario and one decision owner. Agree on the required output, document assumptions, test the method against credible alternatives and define verification. Expand after the method produces a decision people can explain and revisit.
Frequently asked questions
Qualitative categories, semi-quantitative priority scores and quantitative estimates of frequency, loss or other defined outcomes.
Its meaning depends on the inputs. Multiplying category labels produces a local scoring rule, not measured loss.
Not necessarily. Ordinal scoring does not establish proportional differences in probability or consequence.
When estimated loss and treatment effects could change a consequential investment, acceptance or resource-allocation decision.
No. It explores the distributions supplied to the model; assumptions and dependencies still require review.
No. The mean can differ substantially from typical outcomes, particularly for infrequent, costly events.
CVSS describes severity. Enterprise assessment also needs the relevant environment, business consequences and scenario context.
Inherent risk uses a defined baseline; residual risk considers implemented controls and evidence of their effectiveness.
When material evidence, exposure, controls or business dependencies change, and on the agreed review schedule.
An owned response, documented rationale, review triggers and evidence that any implemented treatment achieved its intended effect.
Technology writer and content strategist with 5+ years of experience, including work for a US-based B2B SaaS client and a cybersecurity solution. I create cybersecurity and GRC content, product documentation, and user guides that help technical teams and business leaders understand security capabilities and workflows. Currently working on Confluence documentations on vulnerability management, ITSM, incident management, and continuous control monitoring, alongside SEO and AEO content, and technology partner database development.