Governance, Risk, and Compliance (GRC) functions have evolved from reactive compliance checkpoints into proactive strategic enablers. However, this evolution brings a new challenge—how do you prove the value of GRC to leadership and ensure it drives business outcomes?
GRC programs are foundational to a well-functioning, resilient enterprise. Yet, without the right metrics, these programs can become directionless or even performative. It’s not about tracking all the metrics—it’s about tracking the right ones, the ones that drive decisions, surface risk, and demonstrate value to leadership.
This article breaks down the GRC metrics that actually matter and offers practical tips for setting thresholds, defining KPIs, and reporting effectively to leadership.
What Are GRC Metrics?
GRC metrics are measurable indicators used to track and assess the effectiveness of an organization’s Governance, Risk, and Compliance programs. These metrics serve as a bridge between technical controls and strategic oversight, offering quantifiable insights into how well an organization is managing risks, complying with regulations, and adhering to internal governance policies.
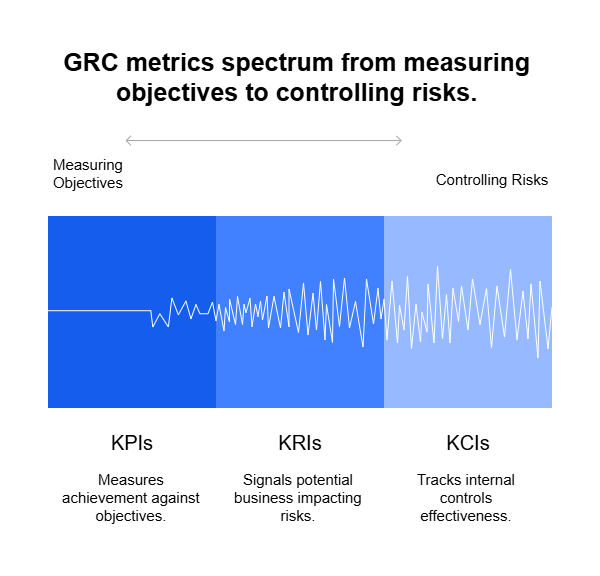
There are several types of GRC metrics, commonly grouped as:
Key Performance Indicators (KPIs): Measure how well GRC activities meet set objectives (e.g., % of completed audits).
Key Risk Indicators (KRIs): Signal potential risks that could impact the business (e.g., number of high-risk incidents).
Key Control Indicators (KCIs): Track the effectiveness of internal controls (e.g., % of controls operating as designed).
By monitoring these indicators, organizations can identify trends, prioritize interventions, and provide leadership with data-driven insights to guide decisions.
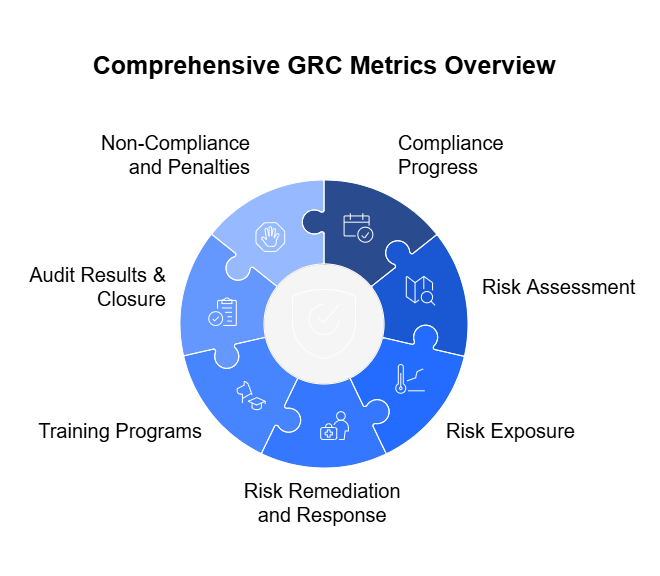
Key GRC Metrics that Matter
1. Compliance Progress
Compliance progress metrics help organizations monitor how well they align with regulatory obligations, internal standards, and industry benchmarks. They ensure that the foundational building blocks of compliance—such as policies, documentation, and attestations—are active and effective.
Key Focus Areas
Policy Acknowledgment Rates: Tracks the percentage of employees who have signed or acknowledged critical policies (e.g., Code of Conduct, Data Privacy).
Policy Review & Update Cycles: Measures how frequently and reliably compliance-related policies are reviewed and revised.
Regulatory Coverage Mapping: Assesses whether organizational controls are adequately mapped to relevant regulatory requirements (e.g., SOX, GDPR, HIPAA).
Compliance Task Completion: Monitors completion of key compliance actions (e.g., document submissions, certification filings) by relevant deadlines.
Internal Self-Assessments: Evaluates periodic self-audits or gap assessments conducted by business units.
Why It Matters
Strong compliance progress metrics prevent regulatory lapses, support audit readiness, and reinforce a culture of accountability.
2. Risk Assessment
Risk assessment metrics evaluate the maturity, coverage, and responsiveness of the risk identification and analysis processes. They enable leaders to understand where vulnerabilities lie and how the organization prioritizes them.
Key Focus Areas
Inventory of Identified Risks: Number and classification of known risks across departments, regions, or processes.
Risk Heat Maps and Trend Analysis: Visual or quantitative tools showing how risk levels evolve over time or escalate in frequency.
Likelihood and Impact Scores: Helps gauge the potential consequence and probability of each risk scenario.
New Risk Discovery Rate: Monitors how often new risks are surfaced, signaling environmental changes or emerging threats.
Scenario Analysis and Stress Testing: Measures the frequency and quality of simulated risk events and their modeled impacts.
Why It Matters
These metrics ensure that the risk landscape is continuously monitored and reassessed, not just during annual reviews or audits.
3. Risk Exposure
Risk exposure metrics reveal the current state of risk in relation to defined thresholds or tolerances. They offer a quantifiable way to evaluate how “safe” or “overexposed” an organization is in various domains.
Key Focus Areas
Overall Residual Risk Level: After mitigation efforts, what level of risk remains for each critical area.
Risks Breaching Appetite or Threshold: Flags risks that surpass acceptable tolerance levels defined by the organization or board.
Exposure by Risk Category: Breaks down exposure by operational, financial, cyber, regulatory, or reputational risk.
Third-Party Risk Levels: Captures the risk scores or classifications of vendors, partners, and other external entities.
Unmitigated or Underfunded Risks: Risks for which there are no approved treatment plans or adequate resources allocated.
Why It Matters
Executives need real-time visibility into where risks exceed boundaries, so decisions can be prioritized and resources mobilized quickly.
4. Risk Remediation and Response
This category focuses on how effectively and efficiently risks are being managed once identified. It highlights the organization’s agility in reducing exposure and preventing recurrence.
Key Focus Areas
Remediation Plan Status: Percentage of risks with approved treatment plans that are on-track, delayed, or stalled.
Time to Remediate: Average duration between identifying a risk and completing its mitigation.
Incident Response Timeliness: Measures time to detect, escalate, respond to, and resolve compliance or risk events.
Repeat Incidents or Failures: Frequency of recurring risks or failures due to inadequate remediation.
Root Cause Analysis Completion: Whether incidents are investigated thoroughly to prevent future occurrences.
Why It Matters
Effective risk response metrics not only prove that the organization is responsive, but that it learns and improves after each incident.
5. Training Programs
Training metrics assess the effectiveness, reach, and retention of GRC-related training initiatives. They support organizational awareness and empower employees to act compliantly and responsibly.
Key Focus Areas
Training Completion Rates: Percentage of employees who completed mandatory training (e.g., anti-corruption, data privacy).
Training Timeliness: Tracks how many completed training before the deadline.
Assessment Scores: Average pass/fail rates or proficiency levels from post-training quizzes.
Training Coverage Gaps: Identifies which business units or roles have incomplete training coverage.
Refresher Training Frequency: Measures how often periodic or follow-up trainings are administered.
Why It Matters
Training metrics reinforce human risk mitigation and provide evidence of due diligence in compliance and governance efforts.
6. Audit Results & Closure
This category quantifies the outcomes of internal and external audits and the responsiveness of the organization in addressing findings.
Key Focus Areas
Total Audit Findings: Number of issues identified during audits, by severity.
Findings Closed on Time: Percentage resolved within the audit team’s defined timelines.
Audit Plan Completion Rate: Percentage of scheduled audits completed as planned.
Issue Aging: How long audit findings remain open beyond target closure dates.
Why It Matters
Audit metrics highlight both compliance posture and management responsiveness, enabling trust with regulators and stakeholders.
7. Non-Compliance and Penalties
These metrics expose where rules were broken, controls were bypassed, and penalties were incurred. They serve as critical retrospective indicators of compliance performance.
Key Focus Areas
Regulatory Violation Incidents: Number of breaches reported to external authorities.
Fines and Settlement Costs: Monetary impact of non-compliance, including penalties, legal fees, and settlements.
Internal Breach Reports: Cases of internal whistleblower alerts or ethics violations.
Exception Requests and Approvals: Number of formal requests to bypass standard compliance processes.
Control Override Frequency: How often critical controls were bypassed or ignored.
Why It Matters
These metrics are crucial for root cause analysis, budget forecasting (e.g., for legal risk), and ensuring that culture and compliance mechanisms are robust.
GRC Metrics Categorized by Type and Functional Area
Functional Area
Metric
Type
Description
Compliance Progress
Policy Acknowledgment Rate
KPI
% of employees who have attested to reading policies
Policy Review Cycle Completion
KCI
% of policies reviewed and updated as scheduled
Compliance Coverage per Regulation
KPI
% of applicable controls mapped to regulatory requirements
Risk Assessment
Top Enterprise Risks by Severity
KRI
List and prioritize risks based on impact and likelihood
Risk Scoring Accuracy
KCI
Effectiveness of risk scoring methodology and data quality
Number of New Risk Events Identified
KRI
Count of newly identified risk events in a given period
Risk Exposure
Risk Appetite vs. Exposure
KRI
Gap between defined appetite and actual exposure
High-Risk Vendor Percentage
KRI
% of vendors categorized as high-risk based on third-party assessments
Number of Risks Above Threshold
KRI
Active risks exceeding tolerable limits
Risk Remediation & Response
Mitigation Plan Completion Rate
KPI
% of active risks with on-track remediation plans
Incident Response Time
KPI
Average time taken to detect and resolve risk events
Control Failure Rate
KCI
Frequency of control breakdowns during operations or audits
Training Programs
Mandatory Training Completion Rate
KPI
% of employees completing risk/compliance training
Post-Training Assessment Pass Rate
KCI
Effectiveness of training based on test results
Audit Results & Closure
Audit Findings Resolved On Time
KPI
% of findings closed within expected timelines
% of Controls Tested
KCI
Control assurance coverage across business units
Repeat Audit Findings
KRI
% of issues reappearing in subsequent audits
Non-Compliance & Penalties
Regulatory Breach Incidents
KRI
Number of compliance breaches reported
Penalties and Fines Paid
KPI
Monetary impact of non-compliance
Number of Reported Exceptions
KCI
Frequency of bypassed controls or policy violations
Setting Thresholds and KPIs: Making Metrics Meaningful
Collecting GRC metrics is only the first step. To transform them into actionable tools for decision-making, organizations must define thresholds and Key Performance Indicators (KPIs) that clarify what “good,” “acceptable,” and “unacceptable” look like. Without benchmarks, metrics are just numbers. With benchmarks, they become insights.
1. Understand Your Risk Appetite and Tolerance
Before you can set meaningful thresholds, you need to clearly define your organization’s risk appetite (the amount of risk you’re willing to take) and risk tolerance (the acceptable variation around that appetite). This foundational step helps contextualize every risk-related metric.
Example: If your appetite for data breach incidents is zero, then even one incident breaches your threshold. If you tolerate low-severity vendor risks up to 10%, set that as the benchmark.
2. Define SMART KPIs
Your KPIs should follow the SMART criteria:
Specific: Focused on a defined goal (e.g., training completion)
Measurable: Quantifiable in numbers or percentages
Achievable: Realistic given your current resources
Relevant: Tied to business outcomes and risk priorities
Time-bound: Linked to a defined time period
Eample: “Close 90% of audit findings within 30 days” is a SMART KPI.
3. Set Alert Thresholds and Escalation Triggers
Thresholds convert metrics into action drivers. You should establish:
Operational thresholds: Used by teams for daily GRC management.
Escalation thresholds: Levels that require reporting to leadership or intervention.
Critical breach thresholds: Events or numbers that trigger incident response or board-level visibility.
Example: If more than 5% of employees fail compliance training, escalate the issue to HR leadership.
Peer and industry benchmarks (via consortiums or GRC maturity models)
Past performance trends (to measure improvement or decline)
📈 According to the GRC 2024 Benchmarking Report, mature organizations resolve 85% of audit findings within 45 days, while less mature programs average 120 days.
5. Automate Tracking and Notifications
GRC platforms can automatically monitor when thresholds are breached, generate alerts, and even initiate workflows. This reduces manual effort and ensures real-time visibility into potential risks or compliance gaps.
Most GRC Tools provide out-of-box reports that provide real-time KPI dashboards and automatic escalation protocols.
This collaboration increases buy-in and ensures that thresholds are both ambitious and realistic.
Reporting GRC Metrics to Leadership: Driving Action Through Insight
Collecting and analyzing GRC metrics is only valuable if the insights are clearly communicated to the people who make decisions. Senior leaders, board members, and executive committees need concise, actionable reporting that highlights what matters—not a deluge of raw data.
1. Focus on What’s Material
Leadership doesn’t need every metric. Focus your reporting on:
Top enterprise risks and emerging threats
Metrics that breach thresholds or show negative trends
Compliance gaps that pose legal or reputational risks
Areas where risk exposure affects strategic objectives
Example: Instead of listing 100 vendors’ risk scores, report on the top 5 high-risk vendors and their remediation status.
2. Use Visual Dashboards
A well-designed dashboard can convey complex insights in seconds. Consider using:
Risk heatmaps to show severity vs. likelihood
Trend lines for key metrics over time
Traffic light indicators (RAG status) to signal threshold breaches
Pie/bar charts for audit status, training completion, or policy coverage
Opt for GRC tools that support dynamic and customizable dashboards for executive reporting.
3. Provide Context, Not Just Data
Data without context leads to misinterpretation. Always accompany metrics with:
Narrative summaries: Explain what the metric means and why it matters.
Comparative benchmarks: Include prior performance or industry norms.
Recommended actions: Suggest how to respond to the insight.
Example: “Training completion dropped 12% last quarter due to onboarding surge. Mitigation plan: auto-enroll all new hires on day one.”
4. Tailor Reporting to the Audience
Different stakeholders care about different things:
Board members want strategic risks, liabilities, and reputational exposure.
CFOs want financial impacts of risk and compliance failures.
CISOs focus on cyber risks, incidents, and control effectiveness.
Business unit leaders care about operational risks and accountability.
Create tiered reports—executive summaries for leadership and detailed reports for functional heads.
5. Highlight Trends and Leading Indicators
Don’t just report snapshots. Leaders need to see:
Trends: Are things getting better or worse?
Leading indicators: Metrics that hint at future problems (e.g., declining training rates)
Lagging indicators: Metrics that show results of past actions (e.g., fines paid)
Use a mix of both to drive proactive vs. reactive decisions.
6. Link GRC to Business Objectives
Make it clear how GRC activities support the company’s strategic goals:
Example: “Vendor cyber risk controls are critical to our digital transformation strategy involving third-party SaaS platforms.”
7. Keep It Concise and Actionable
Executive time is limited. Follow the 3-3-3 Rule:
3 major risks or issues
3 key metrics to watch
3 actions or decisions needed
Use bullet points, bold text, and summaries to aid quick scanning.
Conclusion: Don’t Just Measure—Matter
Let’s be honest—governance, risk, and compliance can sometimes feel like background noise in the rush of quarterly goals, product launches, and market shifts. But when done right, GRC isn’t just a protective layer. It’s a lens that brings clarity. A compass that steers strategy. A voice that speaks up before things go wrong.
The problem isn’t that companies lack data. It’s that too many GRC programs are drowning in it—collecting, monitoring, and reporting metrics that don’t drive any action. That’s a missed opportunity.
The GRC metrics that actually matter are the ones that:
Point to real exposure,
Highlight where momentum is building (or faltering),
And give leaders the confidence to move forward—knowing someone is watching the edges.
So if you’re leading or advising on GRC, your job isn’t just to track risks. It’s to make them visible. Understandable. Actionable. That means setting thresholds with intention. Choosing KPIs that reflect priorities. Reporting with focus and clarity. And always linking back to what the business actually cares about—performance, resilience, reputation, and trust.
Because in a world that changes by the hour, the companies that thrive won’t be the ones that avoided every risk. They’ll be the ones who saw it coming, saw it clearly, and responded fast.