SWOT Analysis and Cyber Risk Quantification: A Practical GRC Strategy for 2026
SWOT analysis can help security leaders identify strategic concerns, while cyber risk quantification can test how those concerns may affect the business. This article explains how to connect the two without treating qualitative observations as financial facts.
Security and governance teams use SWOT analysis to identify strengths, weaknesses, opportunities and threats. However, a SWOT matrix does not define a risk scenario, estimate event frequency or calculate financial loss.
Cyber Risk Quantification (CRQ) serves a different purpose. Open FAIR provides a standardized risk taxonomy and analysis method for estimating loss frequency and magnitude. Monte Carlo simulation is a computational technique that can support that analysis by sampling from defined distributions. Used with documented assumptions, they make the reasoning behind a decision visible and testable.
This distinction matters in 2026. Boards expect security risks to be connected to business services, consequences and accountable decisions. However, neither the US Securities and Exchange Commission’s cybersecurity disclosure rules nor the EU Digital Operational Resilience Act requires every cyber risk to be expressed as a dollar amount. Quantification can support decisions, but it does not replace legal or materiality analysis.
Why SWOT and cyber risk quantification should not be treated as substitutes
A SWOT analysis answers broad strategic questions:
Strengths: Which capabilities may reduce exposure or improve resilience?
Weaknesses: Which internal conditions may increase the chance or impact of loss?
Opportunities: Which changes could improve the organization’s position?
Threats: Which external conditions could contribute to a loss event?
CRQ asks a narrower set of questions:
What specific event are we assessing?
How often could it occur within a defined period?
What losses could follow?
Which controls influence the likelihood or magnitude?
How uncertain are the estimates?
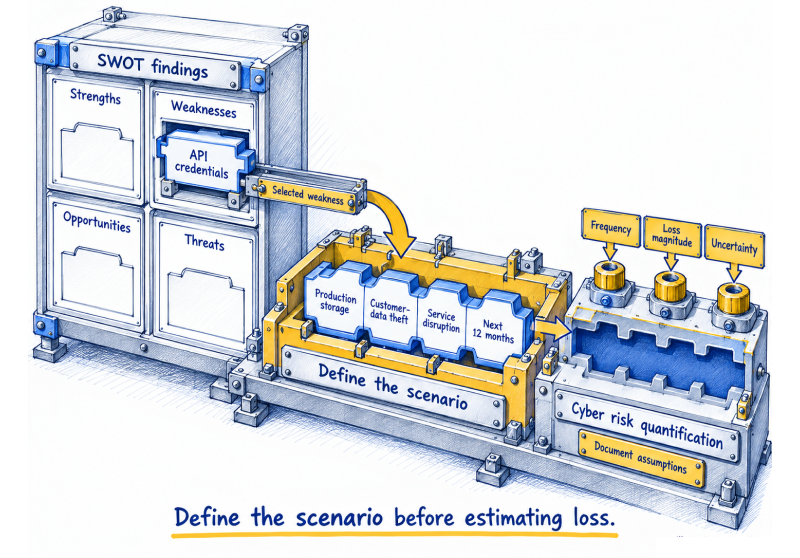
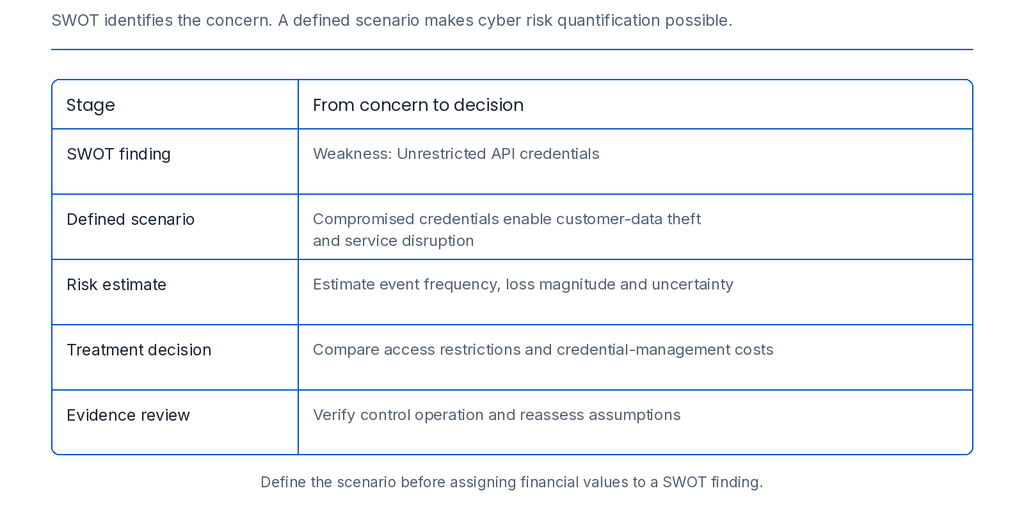
The methods work best in sequence. SWOT identifies where analysis is needed. CRQ turns a selected concern into a defined scenario with defensible estimates.
Qualitative ratings can support prioritization when their scales, evidence and decision rules are clear. Problems arise when “High” or a score of 15 is presented as a measured probability or financial value. Ordinal ratings cannot show how much loss may occur or whether a proposed control is economically justified.
Convert SWOT findings into defined loss scenarios
Do not translate a SWOT entry directly into a financial value. First convert it into a scenario that identifies the asset or service, threat action, business effect and assessment period.
Weak scenario: Weak endpoint security.
Defined scenario: During the next 12 months, an attacker uses an unmanaged workforce endpoint to obtain privileged access, disrupt a customer-facing service and expose regulated customer data.
The defined scenario gives analysts something specific to estimate and lets stakeholders challenge the same assumptions.
Step 1: Validate internal strengths before using them as risk inputs
Illustrative SWOT finding: Strong identity lifecycle controls, with multifactor authentication enforced for 98 percent of in-scope workforce accounts requiring interactive access.
The percentage is useful only when the underlying population is clear. Confirm which employees, contractors and privileged accounts are included, which access paths enforce MFA, and whether bypasses remain possible. Assess non-human identities separately using controls appropriate to their authentication methods. The remaining 2 percent may include low-impact accounts or critical administrative access; coverage alone does not establish effectiveness.
In an Open FAIR analysis, effective authentication controls may reduce susceptibility by increasing resistance to a threat action. They do not necessarily reduce how often threat actors attempt an attack. Threat Event Frequency and vulnerability should therefore be estimated separately rather than lowered together without evidence.
Step 2: Translate weaknesses into scenario-specific conditions
Illustrative SWOT finding: Delayed patching for legacy middleware with elevated administrative access.
Do not assign a financial loss to the weakness by itself. Determine how it changes a defined scenario. Relevant questions include:
Is the middleware reachable by the likely threat actor?
Is exploitation technically feasible?
What privileges could be obtained?
Which services and records depend on the affected system?
Are compensating controls operating and evidenced?
These answers inform likelihood and consequence estimates. They may also show that the organization needs better evidence rather than another scoring workshop.
Step 3: Treat opportunities as proposed changes, not completed risk reduction
Illustrative SWOT finding: Adoption of Continuous Control Monitoring (CCM) and automated GRC capabilities.
An opportunity does not reduce risk until it is implemented and shown to work across the intended scope. Analysts should distinguish the current state from the proposed treatment state. If continuous monitoring improves detection or identifies failed controls sooner, it may reduce the duration or magnitude of some losses. That effect should be estimated from operating evidence, not assumed from the purchase of a platform.
Useful evidence may include control coverage, detection time, investigation time, unresolved findings and the percentage of failed controls corrected within the required period.
Step 4: Connect external threats to frequency and loss consequences
Illustrative SWOT finding: Increased concern about third-party SaaS compromise.
This observation should be separated into assessable scenarios. A supplier outage, unauthorized data disclosure and malicious software update can have different frequencies, affected services and consequences.
For each scenario, estimate the relevant primary and secondary losses. Primary losses may include investigation, containment, restoration and operational disruption. Secondary losses may arise when customers, regulators or contractual counterparties respond to the event. These may include notification costs, legal work, contractual claims or loss of business.
Build estimates that show uncertainty
CRQ should use ranges rather than unsupported single values. Record the source, date and limitation of each estimate, whether it comes from incident history, contracts, recovery exercises, specialists or relevant external data.
Consider this illustrative cloud-storage scenario:
An attacker obtains compromised API credentials, accesses production storage, exfiltrates 50,000 customer records and disrupts the related service during the next 12 months.
Illustrative model inputs: The frequency range describes annual loss-event frequency. Each cost range describes loss per event, conditional on the combined scenario occurring.
Loss Event Frequency: 0.15 to 0.40 events per year.
Incident response and forensic costs: $150,000 to $350,000.
Operational downtime and productivity loss: $400,000 to $900,000.
Legal, regulatory and contractual costs: $200,000 to $1,200,000.
Customer notification and support costs: $100,000 to $250,000.
These figures are hypothetical and should not be used as industry benchmarks. The scenario assumes both exfiltration and disruption occur in the modeled event. If either can occur separately, define separate scenarios or explicit outcome branches.
Before modeling, define each cost category so it does not overlap with another. For this example, customer notification and support are excluded from legal costs, and lost employee time is excluded from incident-response invoices. Treat regulatory penalties and contractual claims as contingent outcomes, with their own occurrence assumptions where appropriate, rather than inevitable expenses.
Ranges alone are not a complete model. Document the distribution chosen for each input, the meaning of its bounds and dependencies between inputs. A longer outage may increase both restoration costs and business interruption, so assuming independence can distort the result.
A Monte Carlo simulation repeatedly samples from the selected distributions to produce a range of possible outcomes. The output is a modeled distribution, not proof of what will happen. A decision report should distinguish loss per event from aggregate annual loss. It may show mean annual loss, annual-loss percentiles, the probability of exceeding a stated tolerance and the assumptions that most influence the result. An annual model must represent the possibility of no events and, where relevant, multiple events. With infrequent events, median annual loss can be zero even when the potential loss is substantial.
Avoid describing a 95th-percentile figure as “95th-percentile expected loss.” Expected loss and percentile loss are different measures. Leadership should also see the uncertainty around the result rather than receiving one precise-looking dollar figure.
Compare the current state with the proposed treatment state
Quantification becomes useful when it supports a decision. Model the scenario under current controls, then model the expected effect of a proposed treatment. The comparison should state:
which factor the treatment is expected to change;
the evidence supporting that change;
implementation and operating costs;
remaining uncertainty;
the residual risk after treatment; and
the owner responsible for validating the result.
A $250,000 control should not be justified by claiming that it removes $1.8 million of loss unless the model, evidence and uncertainty support that conclusion. The analysis should show how the treatment changes the frequency or magnitude distribution and whether the remaining exposure falls within approved tolerance.
A worked treatment decision
Consider the cloud-storage scenario above. For a deliberately simplified calculation, assume uniform distributions within the stated ranges, independence between annual frequency and loss per event, and additive, non-overlapping costs. These assumptions illustrate the calculation; they are not a validated assessment or a full FAIR analysis.
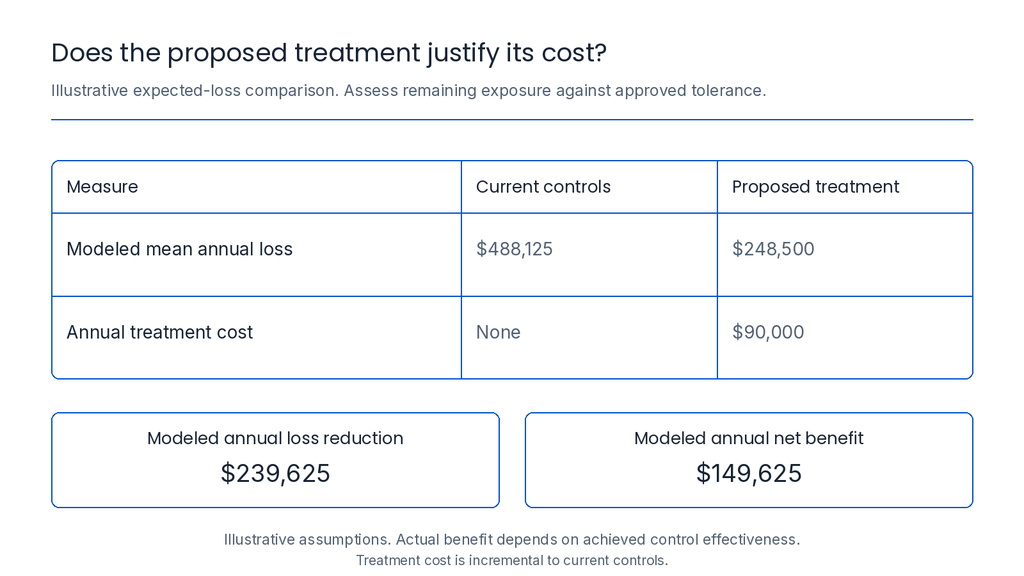
The midpoint annual frequency is 0.275 events. The four midpoint cost estimates total $1,775,000 per event. Their product gives an illustrative mean annual loss of $488,125. This expected-value calculation does not produce annual percentiles or a probability of exceeding tolerance.
Suppose a proposed treatment strengthens API credential management and access restrictions. Assume, for illustration only, that it lowers loss-event frequency to 0.08 to 0.20 events per year while leaving loss magnitude unchanged. This reduction is a hypothesis requiring validation, not an established effect of the control.
Decision measure
Current state
Proposed treatment state
Annual loss-event frequency
0.15 to 0.40
0.08 to 0.20
Mean loss per event
$1,775,000
$1,775,000
Mean annual loss
$488,125
$248,500
Incremental treatment cost
None
$90,000 per year
Under these assumptions, mean annual loss falls by $239,625, leaving an illustrative annual benefit of $149,625 after treatment cost. Both figures depend on the frequency reduction being achieved. At a $90,000 annual cost, the treatment needs to reduce frequency by about 0.051 events per year to break even on this simplified expected-loss basis.
The decision is to proceed to a scoped pilot and validate the frequency-reduction assumptions before approving full rollout. The service owner should confirm restricted access paths, credential revocation and control coverage with the security team. Finance should review the loss estimates and full lifecycle cost. The accountable risk owner must still evaluate severe-loss exposure, obligations and tolerance before accepting the remaining risk. A favorable mean-loss comparison alone does not establish that residual risk is acceptable.
Use regulatory requirements accurately
SEC cybersecurity disclosure
For domestic registrants subject to Form 8-K, Item 1.05 of Form 8-K generally requires disclosure within four business days after the company determines that a cybersecurity incident is material. The deadline does not begin when the incident first occurs or is discovered. The materiality determination must be made without unreasonable delay and considers whether a reasonable investor would view the information as important.
The SEC rule does not require companies to use FAIR, Monte Carlo simulation or dollar-denominated estimates. CRQ may inform the analysis, but legal counsel, finance, security and management must consider the full set of quantitative and qualitative information.
DORA
DORA establishes digital operational resilience requirements for covered EU financial entities. Applicable since 17 January 2025, its requirements include ICT risk management, incident management and reporting, resilience testing and ICT third-party risk management. It also provides for voluntary cyber threat information-sharing arrangements, subject to specified safeguards.
DORA does not require organizations to replace qualitative risk methods with a specific CRQ model. Quantification can help compare disruption scenarios, treatment options and tolerance thresholds, but it should be positioned as a management method rather than a mandatory DORA calculation.
Keep quantification connected to current evidence
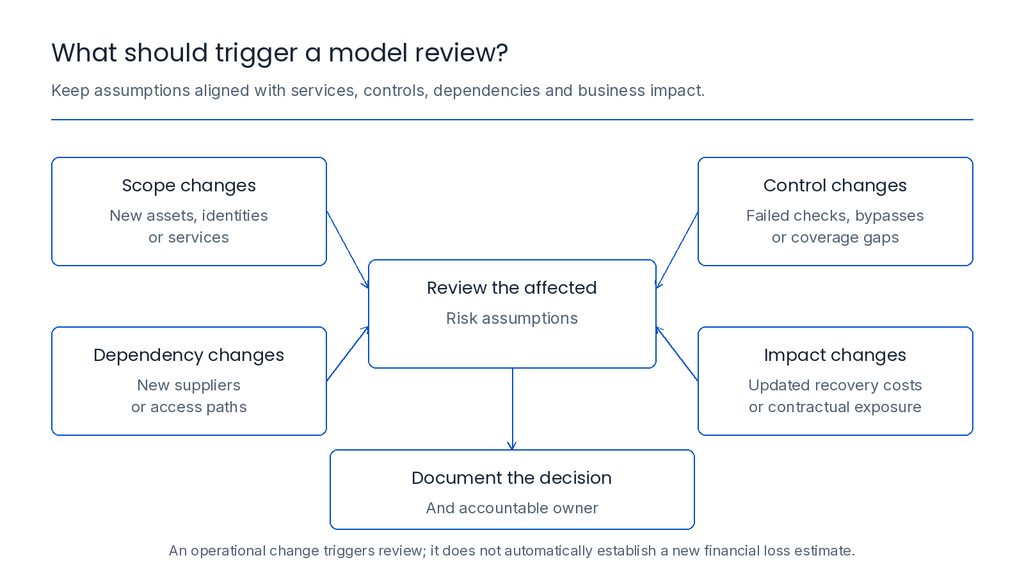
Risk models become stale when the control state, asset population, supplier dependency or business impact changes. Continuous Control Monitoring can help identify those changes and provide evidence about control coverage, health and effectiveness.
SPOG.AI’s continuous control monitoring capabilities can help teams connect defined controls with operational evidence across relevant systems. This evidence may inform risk-model assumptions, but the mapping between evidence and a FAIR factor still requires documented analytical judgement.
SPOG.AI’s governance, risk and compliance capabilities can also help organizations connect requirements, findings, controls, services and accountable owners. This supports a traceable decision process without suggesting that every operational signal should automatically change a financial risk estimate.
Conclusion
SWOT analysis and cyber risk quantification solve different problems. SWOT helps leaders identify strategic conditions worth investigating. CRQ helps analysts estimate the frequency and magnitude of a defined loss scenario.
The strongest GRC process does not force every SWOT entry into a dollar figure. It selects material scenarios, validates current evidence, documents uncertainty and compares decision options. The result is not mathematical certainty. It is a more transparent basis for choosing where to accept, reduce, transfer or avoid risk.
Frequently asked questions
No. SWOT can identify strategic concerns, but it does not define loss scenarios, estimate frequency or measure financial consequences. It should be used as an input to deeper analysis.
No. The rule requires domestic registrants subject to Form 8-K to disclose material cybersecurity incidents, generally within four business days after determining that an incident is material. It does not mandate FAIR, Monte Carlo simulation or dollar-based analysis.
No specific CRQ method is mandated. DORA requires covered financial entities to manage ICT risk and operational resilience. Quantification can support those decisions but does not replace the required governance, testing and reporting processes.
First define a loss scenario. Then determine whether the weakness affects event frequency, susceptibility or loss magnitude. Record the evidence and uncertainty instead of assigning the SWOT label directly to a FAIR factor.
It samples repeatedly from input distributions to show a range of possible outcomes. The result can help leaders understand median loss, percentile loss and the probability of exceeding a tolerance threshold.
Primary loss follows directly from the event, such as investigation, restoration and downtime. Secondary loss results from the reactions of customers, regulators or contractual counterparties.
Yes. It can begin with a few material scenarios, calibrated ranges and clearly documented assumptions. Specialized mathematicians are not required for every assessment, but analysts need appropriate training and review.
CCM can show when control coverage, health or effectiveness changes. Analysts can use that evidence to decide whether a model assumption should be reassessed. The risk estimate should not change automatically without an agreed mapping and review rule.
No. Open FAIR is a widely used standardized taxonomy and analysis method, but organizations may use other suitable approaches. The selected method should fit the decision, available evidence and required level of assurance.
Set a formal review cadence and reassess when a material input changes, such as service scope, threat conditions, control performance, supplier dependency, contractual exposure or regulatory obligation.
With 8.5+ years in B2B SaaS, I’ve led demand generation and GTM initiatives across global markets (US, UK, Europe, Africa), helping companies move from fragmented marketing efforts to structured, revenue-focused growth engines.