Quantitative Cyber Risk Assessment in 2026 for Better GRC Decisions
Quantitative cyber risk assessment helps teams decide which security treatments justify their cost. Defined scenarios, current evidence and explicit uncertainty make the estimates useful to security, finance and business owners.
What quantitative cyber risk assessment should help you decide
A security team has funding for one improvement: tighten privileged access or improve recovery. Quantitative cyber risk assessment helps compare those options by estimating how often a loss event could occur and what it could cost.
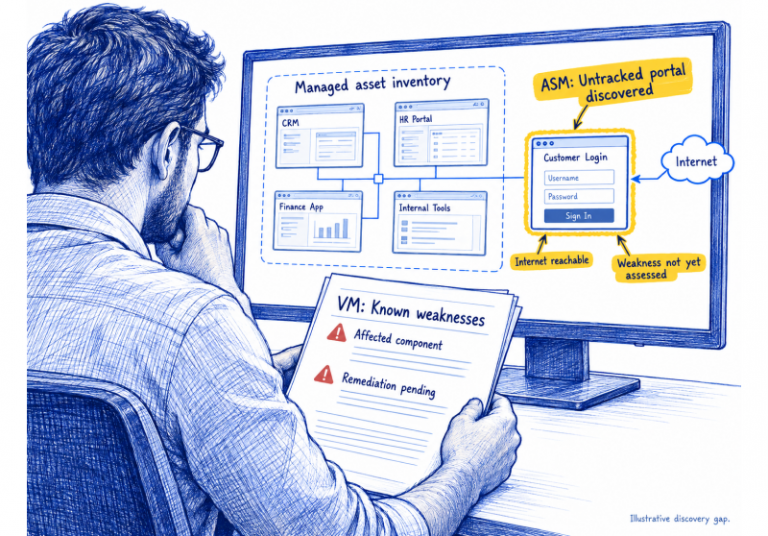
In 2026, cloud services, identities and supplier dependencies can change while an assessment is still in use. Current operational evidence helps identify assumptions that need review. It does not automatically translate into a reliable financial estimate.
Select scenarios relevant to the investment decision.
A likelihood rating of four multiplied by an impact rating of three produces an ordinal score, not a measured probability or dollar loss. Such scores can organize discussion, but cannot establish the economic value of a treatment.
How to build a quantitative cyber risk assessment
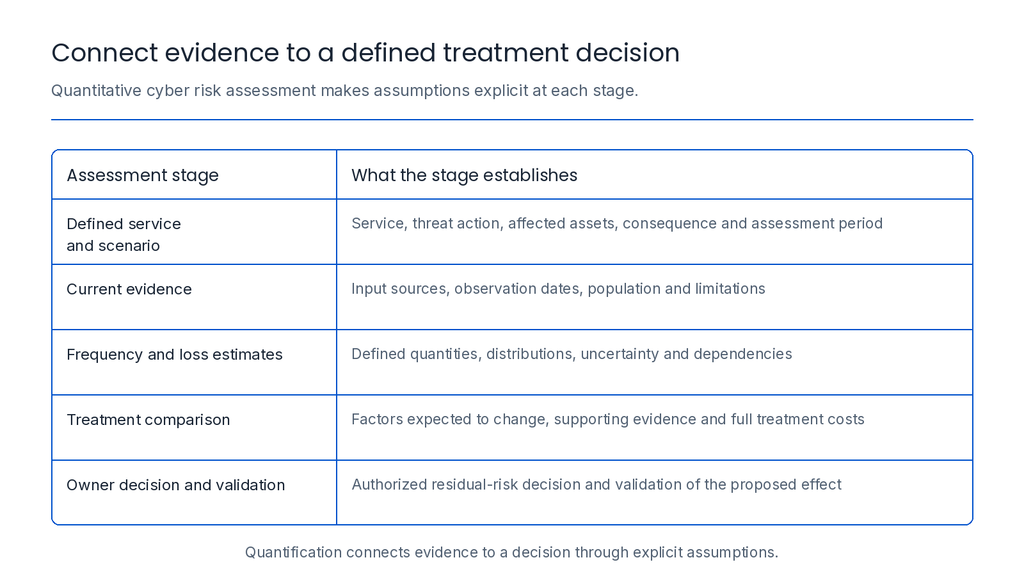
1. Define the service and loss scenario
Define the service, threat action, affected assets, consequence and assessment period. A vulnerability record alone does not establish business risk.
For example: during the next 12 months, an external attacker uses an exposed API credential to retrieve customer payment records from production storage, creating investigation, notification and contractual costs.
Read access does not establish the ability to disrupt the service. Assess disruption separately where appropriate. Confirm permissions, reachable data and affected customers before estimating loss.
Ask the service owner to validate business impact and the security owner to confirm access and control assumptions.
2. Gather evidence and record its limitations
Use inventories, identity records, configuration results and incident history to establish current conditions. Finance, contracts and recovery exercises help estimate costs and dependencies.
Record each input’s source, date, population and limitation. Workforce MFA coverage may exclude privileged access paths. Successful backups do not prove timely restoration.
Distinguish deployment from effective operation. Record missing data as uncertainty requiring investigation.
3. Estimate frequency and loss magnitude
Factor Analysis of Information Risk (FAIR) structures analysis around loss frequency and magnitude. Open FAIR provides standardized taxonomy and methods. Monte Carlo simulation supports analysis by sampling repeatedly from specified distributions.
Threat Event Frequency describes how often relevant threat actions occur. Susceptibility, or FAIR vulnerability, is the probability that a threat event becomes a loss event, assessed through threat capability relative to resistance strength.
Loss Event Frequency depends on threat frequency and susceptibility. Better authentication may reduce successful compromise without reducing attack attempts; changing both factors requires separate evidence.
Loss magnitude includes primary losses directly associated with the event and secondary losses arising from stakeholder reactions. Investigation, restoration and downtime may be primary losses. Legal claims, penalties or lost business may arise through secondary reactions. Classification depends on the causal pathway, not simply the expense label.
Define what each range means: minimum and maximum values differ from percentile bounds. Document distributions, prevent double counting and consider dependencies. A longer outage may increase several costs together.
4. Compare options and assign the decision
Model current exposure and the proposed treatment using the same scenario boundaries. Specify which frequency or magnitude factor changes, why it changes, and how the organization will validate that effect.
Include implementation, operating and disruption costs. Compare expected benefit, severe outcomes and uncertainty. Obtain the accountable risk owner’s decision and approval of residual risk under established authority rules.
Active exploitation, obligations and operational constraints also determine priority. Contain an exposed live credential under established procedures without waiting for a financial model.
A worked quantitative cyber risk assessment comparison
Consider two hypothetical scenarios assessed over one year. Scenario A involves compromise of segmented workstations. Assume investigation confirms that these systems do not hold production credentials or provide a privileged route to critical services. Scenario B involves unauthorized access to payment records through an exposed API credential.
Illustrative inputs assume uniform distributions, non-overlapping costs and independence between frequency and loss per event. They are not benchmarks or simulation outputs.
Measure
Scenario A
Scenario B
Annual loss-event frequency
0.02 to 0.08 events
0.20 to 0.50 events
Loss per event
$10,000 to $50,000
$800,000 to $2,000,000
Midpoint annual frequency
0.05 events
0.35 events
Mean loss per event
$30,000
$1,400,000
Mean annual loss
$1,500
$490,000
Mean annual loss is 0.05 × $30,000 = $1,500 for A and 0.35 × $1,400,000 = $490,000 for B. These calculations follow the assumptions; they do not validate them.
Revoke the exposed credential in B, investigate access and restore legitimate integrations safely. Remediate A according to exploitation evidence and policy. Reassess its estimate if privileged access or production credentials are discovered.
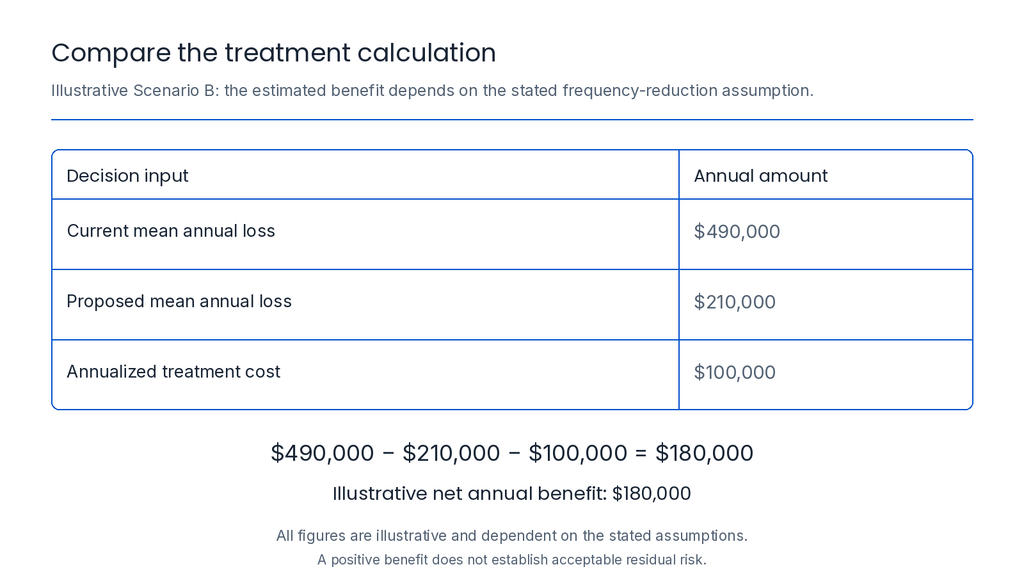
For a longer-term treatment of Scenario B, suppose tighter credential permissions and lifecycle controls are hypothesized to reduce annual frequency to 0.10 to 0.20 events, with loss per event unchanged. Midpoint frequency becomes 0.15, giving mean annual loss of $210,000. At $100,000 in annualized treatment cost, the illustrative net annual benefit is $490,000 − $210,000 − $100,000 = $180,000.
Before approving treatment, validate the assumed frequency reduction and test less favorable assumptions. The positive benefit does not establish acceptable residual risk.
Report expected loss and severe outcomes separately
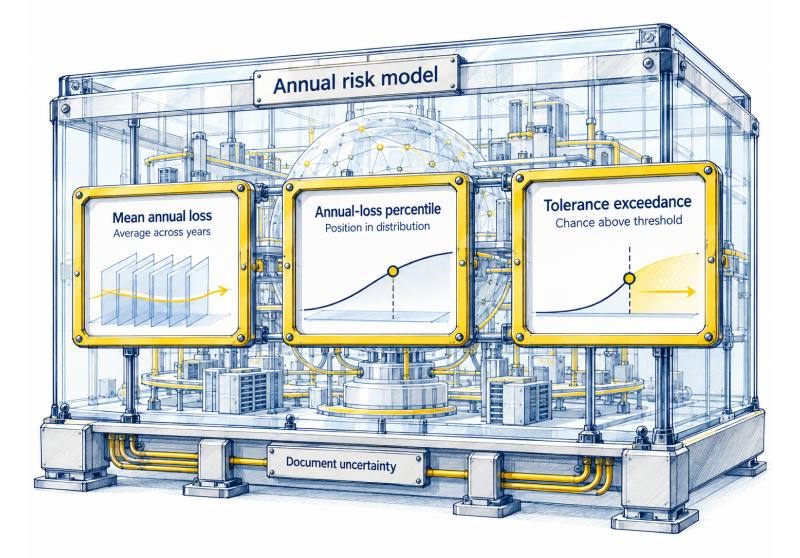
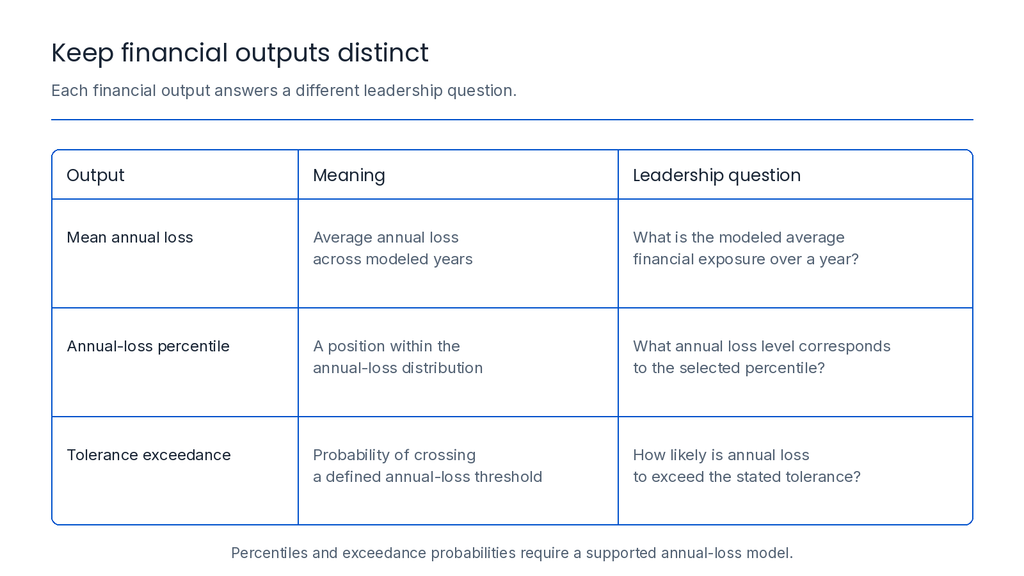
Annualized Loss Expectancy (ALE) is expected financial loss over a year, a mean. ALE is not the entire annual-loss distribution.
A modeled 95th-percentile annual loss answers a different question: what annual loss level is not exceeded in 95 percent of modeled outcomes? Producing that figure requires an annual event-count model, loss distributions and documented dependencies. Frequency and cost ranges alone do not justify a percentile result.
Report mean loss, severe outcomes and tolerance exceedance where supported. An infrequent-event model may have a zero annual median despite substantial exposure. Label the horizon and assumptions.
Keep compliance claims precise
For domestic registrants subject to Form 8-K, SEC Item 1.05 generally requires disclosure within four business days after determining that a cybersecurity incident is material. Materiality must be determined without unreasonable delay. Quantitative and qualitative considerations matter; there is no universal dollar threshold or requirement to use FAIR.
Legal counsel and management must assess the actual incident’s significance. A prospective annual risk estimate cannot replace that assessment.
DORA, applicable since 17 January 2025, establishes ICT risk management and operational resilience obligations for covered EU financial entities. Potential penalties belong in a scenario only where relevant obligations, enforcement conditions and stakeholder responses support the estimate.
Where SPOG.AI supports the assessment
SPOG.AI’s continuous control monitoring connects defined controls with operational evidence to assess coverage and effectiveness, identify material gaps and support accountable remediation. Analysts can use that evidence to review whether a risk-model assumption still holds.
For quantitative analysis, the mapping from a control result to a frequency or loss estimate still requires documented reasoning. A failed recovery control may primarily affect loss duration or magnitude; it should not automatically increase attack frequency. Set review triggers around material changes, assign an analyst and retain the reason for each model revision.
Check the treatment after implementation
Choose one service and one treatment decision. Validate the scenario with its owners, compare options and record the assumptions. After implementation, check that the treatment operates across the intended population and revisit its estimated effect.
Frequently asked questions
It estimates the frequency and consequences of defined cyber loss scenarios using numerical inputs, documented assumptions and uncertainty. Financial estimates help compare treatment options and explain business exposure.
Yes. Clear categories and evidence can support prioritization and discussion. Ordinal scores should not be presented as measured probabilities or financial losses.
FAIR structures analysis around loss frequency and magnitude. It helps distinguish threat activity, susceptibility, resistance and consequences so analysts can examine their assumptions consistently.
No. CVSS communicates vulnerability severity. Base scores describe intrinsic characteristics, while Threat and Environmental metrics add context. Service consequences and treatment decisions still require broader risk analysis.
Use contracts, recovery exercises, relevant incidents and calibrated specialist estimates. Define cost boundaries, contingent outcomes and uncertainty. Revise estimates when better evidence becomes available.
CCM supplies evidence about control coverage and operation. Analysts use it to identify changed assumptions and decide whether reassessment is warranted, with explicit mapping and review rules.
No. It requires applicable incident disclosure, generally within four business days after determining materiality. CRQ may inform that determination, alongside qualitative considerations, but no named quantification method is mandated.
Yes. Start with a small number of material scenarios and trained analysts, involving finance and service owners. Simple, transparent calculations can be useful when their limitations are clear.
ALE is mean annual loss. A percentile identifies a position within a modeled loss distribution. They answer different questions and should be labeled separately.
Use a formal review cadence and reassess after material changes to service scope, access paths, threat conditions, control effectiveness, supplier dependencies or business consequences.
Technology writer and content strategist with 5+ years of experience, including work for a US-based B2B SaaS client and a cybersecurity solution. I create cybersecurity and GRC content, product documentation, and user guides that help technical teams and business leaders understand security capabilities and workflows. Currently working on Confluence documentations on vulnerability management, ITSM, incident management, and continuous control monitoring, alongside SEO and AEO content, and technology partner database development.