GRC
How Fintech Startups Build Enterprise-Ready Information Security
Fintech startup security must protect money, identity and financial data across live workflows enterprise buyers depend on. A...
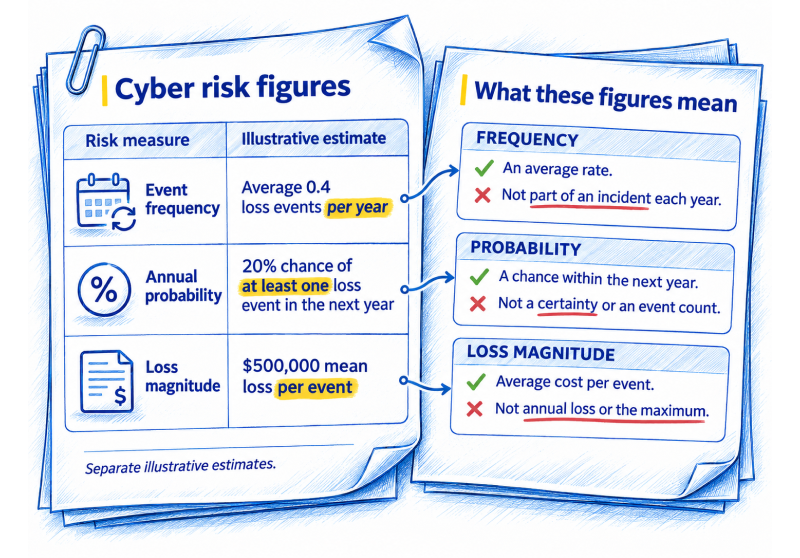
A report saying “cyber exposure is $2 million” leaves essential questions unanswered. It might describe the cost of one incident, average annual loss, a severe modeled outcome or an insured amount. Those meanings cannot be exchanged simply because they share a currency symbol.
Financial language gives security, finance and business teams a common basis for discussion only when they understand the quantities behind it. The starting point is literacy: knowing what a risk statement says, what it leaves open and which conclusions its numbers support.
Cyber risk quantification, or CRQ, estimates the frequency or likelihood and consequences of defined cyber loss scenarios. Financial CRQ expresses consequences in monetary units. A useful statement identifies the scenario, time horizon, loss measure and relevant conditions rather than presenting a single organization-wide number without explanation.
A financial estimate describes possible economic harm. It does not directly measure security maturity, compliance or vulnerability severity. A score of 80 out of 100 has a different meaning from a 20% modeled annual probability or $500,000 mean annual loss. Arithmetic does not make these measures interchangeable.
NIST IR 8286A Revision 1, finalized in December 2025, places documented risk scenarios and likelihood and impact estimates within enterprise risk management. That context matters: the quantities should describe consequences relevant to the organization’s objectives.
A threat is a potential source of harm. A vulnerability is a weakness that could be exploited or triggered. An asset or service is something the organization values or depends on. A loss event is the occurrence whose harmful consequences are being counted. These terms describe different parts of a causal explanation.
Consider a criminal using a stolen support credential to alter refund instructions. The credential and excessive permissions are conditions; unauthorized changes are actions; fraudulent refunds and response costs are consequences. “Refund fraud” names the concern but does not tell the reader which event or losses the estimate includes.
A scenario connects those elements within a boundary. Its purpose in a report is to make the number interpretable. An estimate for one customer-service application should not be read as exposure across every payment channel, supplier or business unit.
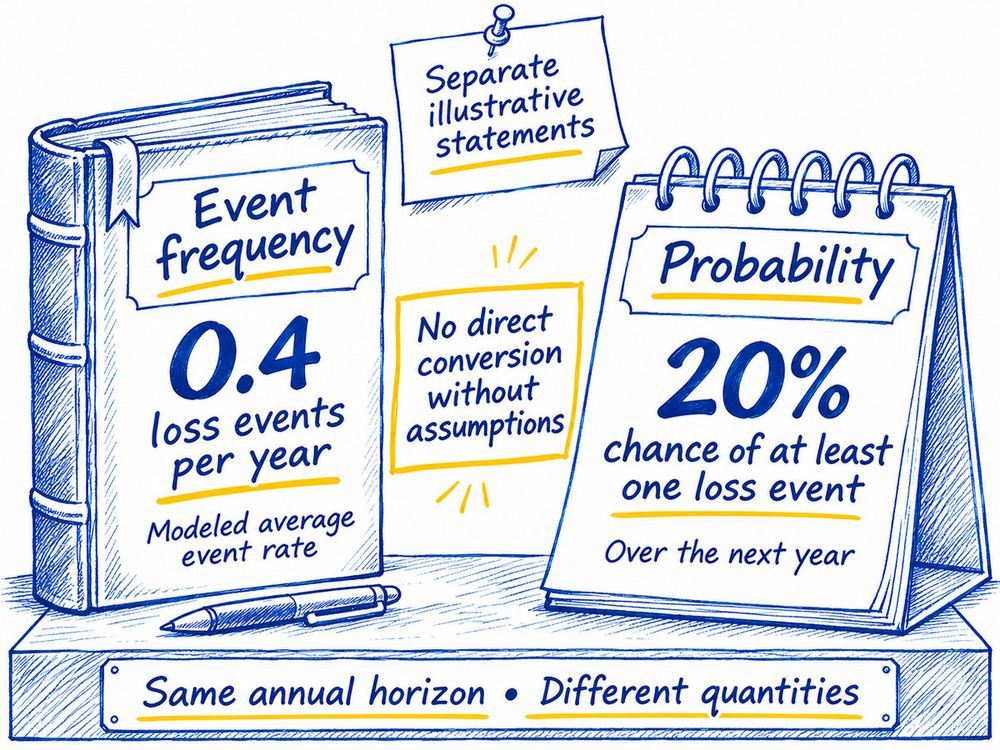
Frequency describes how many events occur, or an estimated event rate over time. A modeled average of 0.4 loss events per year can coexist with years containing no events and years containing more than one. It does not mean part of an incident occurs each year.
Probability describes the chance of a specified outcome. “A 20% chance of at least one qualifying loss event in the next year” concerns a particular event definition and horizon. It differs from a 20% chance of loss exceeding a stated amount. Readers need the rest of the sentence, not just the percentage.
A frequency is not automatically the probability of at least one event. Converting between them requires assumptions about the event process. Likewise, a yearly probability cannot simply be multiplied by three to obtain a three-year probability. Changing the horizon changes the question and may change the conditions being modeled.
Loss magnitude describes how much harm follows an event. In financial terms, it may include investigation, restoration, interrupted business, customer response and other supported consequences. Which costs appear depends on the scenario. A data disclosure and a service outage can create different losses even when both begin with compromised access.
Read cost labels carefully. Revenue interrupted during an outage is not necessarily revenue permanently lost. Lost revenue is not the same as lost profit. Gross loss describes exposure before specified recoveries, while a net figure depends on which recoveries, insurance terms or other adjustments are included.
Some losses depend on later reactions, such as a claim, enforcement action or customer departure. Including them does not make them inevitable. Safety, trust and strategic effects may also remain material when monetary conversion is unreliable. A financial total should not silently stand for every consequence.
Expected annual loss is the modeled average annual financial loss under stated assumptions. The word “expected” can mislead readers into treating the average as the most likely result. A distribution with many zero-loss years and occasional large losses may have a positive mean and a zero median.
A percentile describes a position in a distribution. A modeled 95th-percentile annual loss of $2 million means that annual losses are no greater than that amount in at least 95% of the modeled distribution. It does not establish an absolute maximum or guarantee that the model represents reality.
An exceedance probability asks how likely loss is to be greater than a threshold during a stated period. It differs from the chance of any incident. Neither a percentile nor a threshold probability is meaningful without knowing whether it concerns one incident or total annual loss.
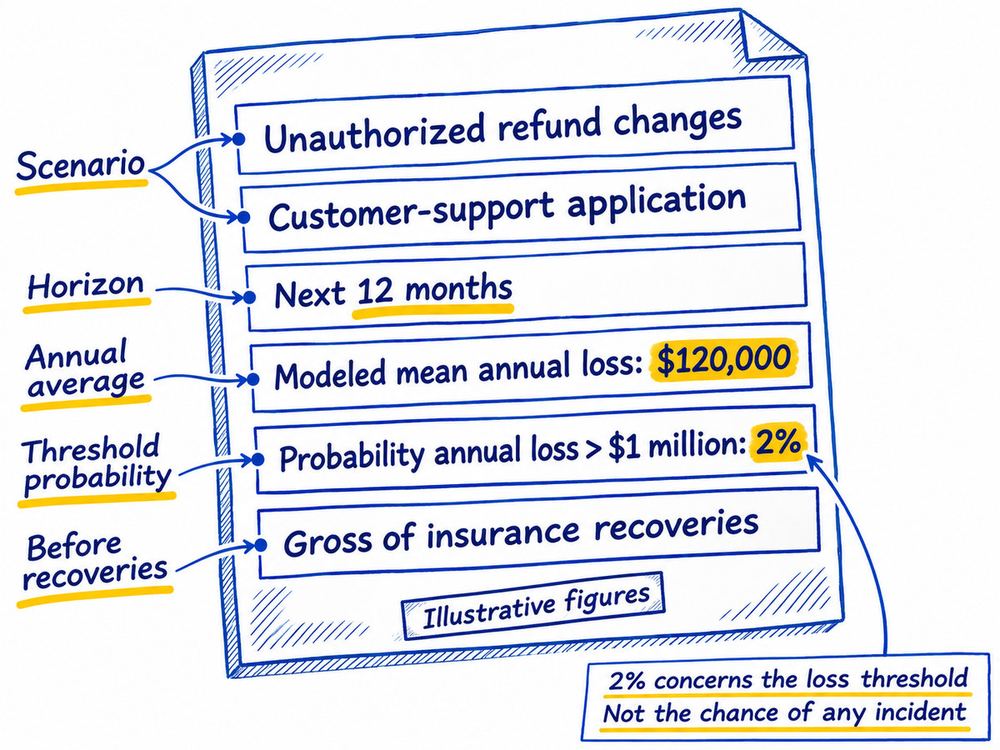
Consider this illustrative report statement: “For unauthorized refund changes in the customer-support application over the next 12 months, modeled mean annual loss is $120,000. Modeled probability of annual loss exceeding $1 million is 2%. Figures are gross of insurance recoveries.” These invented values explain terminology; they are not benchmarks.
The $120,000 figure describes the modeled annual average. It is not a predicted invoice, a per-incident cost or the maximum exposure. The 2% figure concerns crossing the $1 million annual threshold; it does not state the probability of any refund incident. “Gross” means readers should not subtract an assumed insurance payout.
Both quantities can be valid descriptions of the same model. They answer different questions. The statement still leaves the reader needing its assumptions, exclusions, estimation date and uncertainty before treating it as dependable. No treatment recommendation follows from those two numbers alone.
Variation concerns differences in possible outcomes: one event may be contained quickly while another affects more transactions. Uncertainty concerns what is not known about the scenario, inputs or model. More evidence may narrow uncertainty without eliminating the variation in losses that could occur.
A range needs a definition. It might describe minimum and maximum assumptions, selected percentiles of possible losses or uncertainty around an estimated mean. The same endpoints can therefore communicate different things. “$100,000 to $1 million” is incomplete until its meaning and period are stated.
Simulation generates outcomes from a model and its supplied assumptions; it does not observe future incidents. FAIR is a structured information-risk model, while Monte Carlo is a simulation technique. Knowing these labels helps interpret a report, but the label itself does not establish reliability.
A reader should be able to restate the event, the period, the financial measure and the important exclusions. If the report mixes per-event losses with annual figures, current conditions with proposed controls, or gross exposure with recoveries, the numbers need clarification before comparison.
Operational records can support that understanding. SPOG.AI’s GRC and Continuous Control Monitoring capabilities can help connect risk context and control evidence. They do not independently prove a financial estimate. Keep the evidence behind a claim separate from the mathematical meaning of the output.
Understanding cyber risk quantification concepts makes conversations more precise. Read each figure as a qualified statement about possible loss, then use the appropriate deeper guide when the task becomes conducting an assessment or selecting a method.

Fintech startup security must protect money, identity and financial data across live workflows enterprise buyers depend on. A...
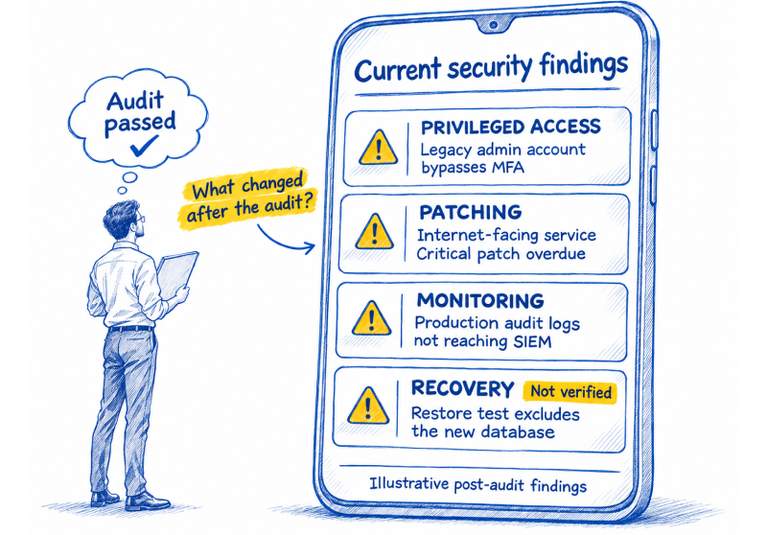
Balancing security and compliance to prevent cyberattacks requires more than passing an audit or buying another security tool....
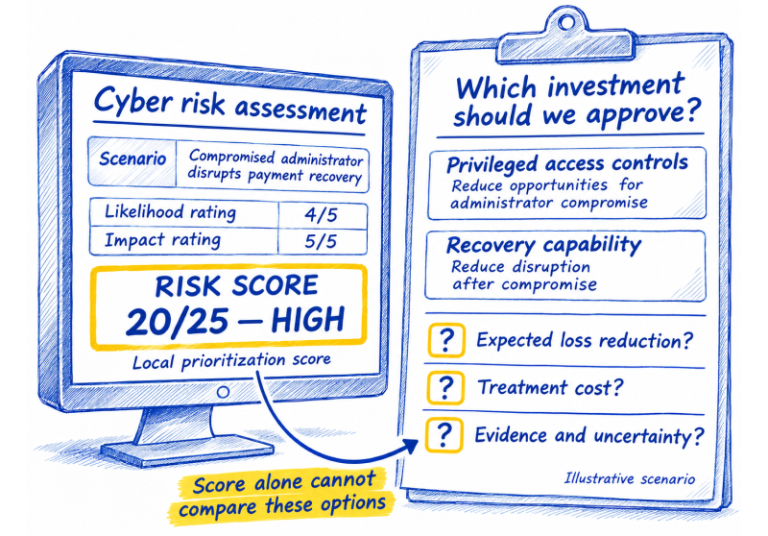
The right cyber risk quantification method is the one that produces evidence a decision-maker can use without implying...