Cybersecurity Risk Management Techniques: Choose the Right Method
Different risk questions need different methods. Compare practical techniques, see how two methods reach different decisions on the same supplier scenario, and choose an approach that fits the evidence and decision at hand.
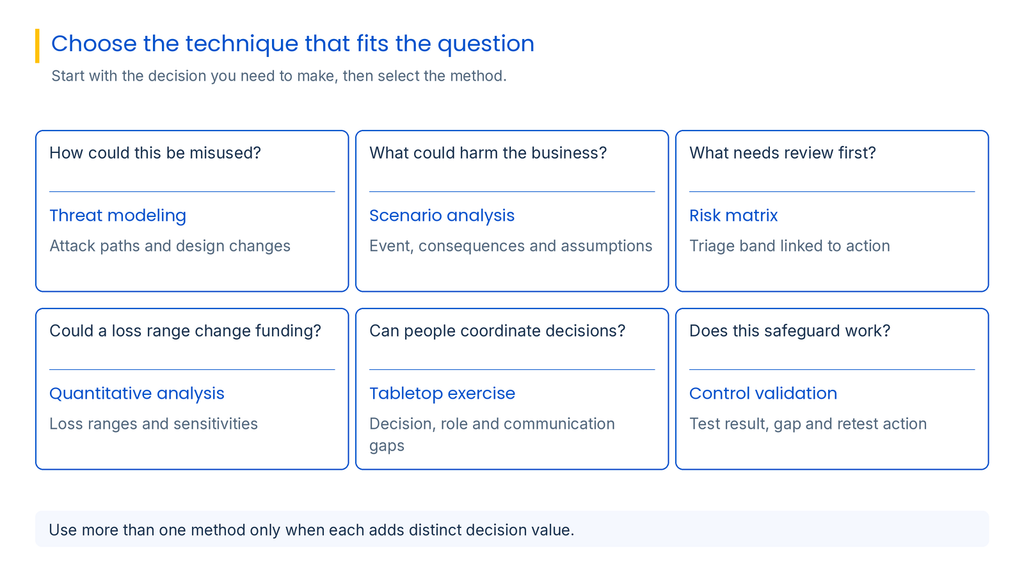
Cybersecurity risk management techniques answer different questions. Threat modeling finds attack paths; scenario analysis connects an event to business loss; a matrix supports triage; quantitative analysis estimates loss ranges; a tabletop tests decisions under pressure. Familiarity alone is a poor reason to choose a method.
Start with the decision: approve an integration, compare remediation options, rank risks, estimate exposure or test readiness. Choose a method whose output fits.
Begin with a question, then choose the technique
A technique answers a question, not a full risk program. Specify the decision owner, deadline and output. Integration design may call for threat modeling; portfolio triage, a matrix; safeguard investment, quantification.
NIST’s 2025 guidance places risk identification, estimation and prioritization in the context of enterprise objectives. Methods describe and compare risk; decision makers apply business context and judgment. A score cannot make the choice for them.
Compare cybersecurity risk management techniques
Use the “best question” column to match the method to the decision.
Technique
Best question
Inputs
Typical output
Main limitation
Threat modeling
How could this be misused?
Architecture, flows, boundaries, identities
Attack paths; design changes
Scope and system knowledge
Scenario analysis
What event could harm an objective?
Asset, event, conditions, impacts
Scenario and assumptions
May omit or double-count events
Risk matrix
What needs review or escalation?
Likelihood/impact bands; current evidence
Triage band linked to action
Ordinal, not measured loss
Quantitative analysis
Could a loss range change investment?
Frequency/magnitude data or estimates
Loss range and sensitivities
Weak inputs create false precision
Tabletop exercise
Can people coordinate decisions?
Roles, updates, response plans
Decision and role gaps
Discussion does not test controls
Control validation
Does the safeguard work in scope?
Objective, test, evidence, sample
Result, gap, retest action
Proves only tested scope and time
Use threat modeling to find attack paths
Use threat modeling to examine how a system, integration or process could be misused. Sketch components, data flows, trust boundaries, identities and privileged actions. Trace who could act, what they could change, and how the action could be detected or contained.
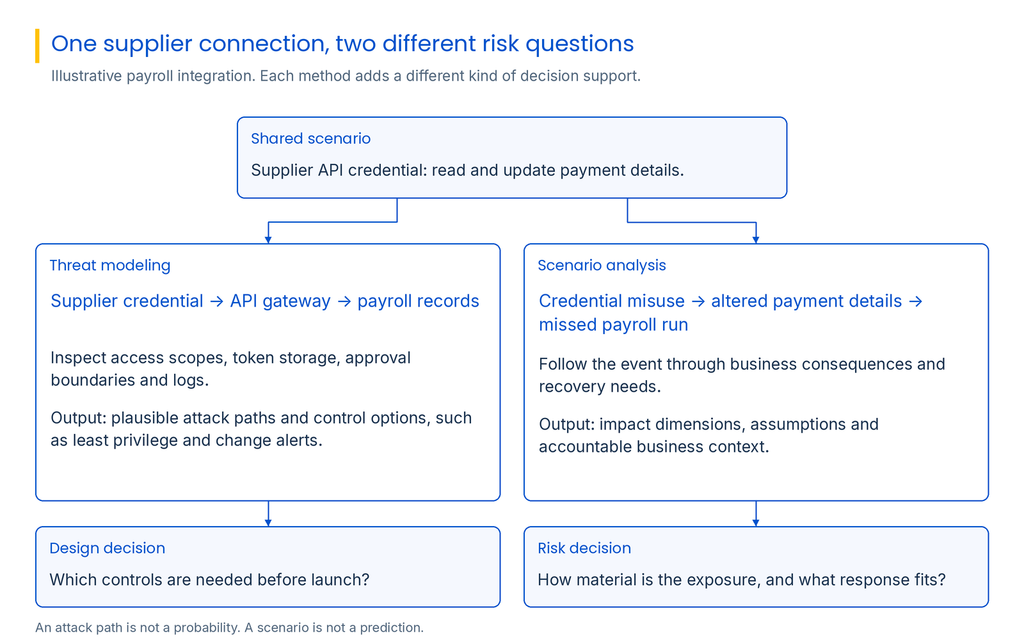
For a payroll integration, tracing a supplier credential through an API to payment records may expose excessive write access, a weak approval boundary or missing change alerts. The output is plausible attack paths and design changes, not a probability or loss estimate.
Use it during design or after a material change. It depends on system knowledge and can miss out-of-scope risks, such as supplier-side compromise.
Use scenario analysis to connect an event to business impact
Scenario analysis follows a defined event through its causes and consequences. State the asset or process, threat event, enabling conditions, affected objective and plausible impact. Separate facts from assumptions, then consider controls and recovery needs.
Use it to explain a technical finding to a business owner or compare it with other risks. An unauthorized supplier change to payroll details could delay payments and require investigation, reconciliation and employee communication. The output is a business-focused scenario with explicit assumptions and impact dimensions.
Scenario analysis is not a prediction; teams can miss events or double-count causes. Review assumptions with technical and process owners. NIST’s current guidance describes scenario documentation as an input to risk analysis and prioritization.
Use a risk matrix for consistent triage
A risk matrix sorts scenarios by likelihood and consequence. Use it for first-pass triage, escalation or portfolio review. Define bands with examples tied to operations, data, obligations and tolerance, then map each band to a next step.
Matrix bands are ordinal, not loss values. Risks in one cell may need different actions. Keep the score’s drivers; color is not a rationale.
Use quantitative analysis when the decision needs a loss range
Quantitative analysis estimates loss frequency and magnitude, preferably as ranges. It can compare safeguard costs with plausible losses or inform recovery and insurance choices. Use incident, exposure and cost data where available, and document input sources and confidence.
Use it when a defensible range could change investment, priority or acceptance. With sparse data, use bounded estimates and sensitivity analysis to show which assumptions drive the result.
It can mislead when estimates look measured or omit costs. Skip modeling when qualitative analysis settles the choice.
Use tabletop exercises to test decisions and coordination
A tabletop brings relevant roles together to discuss a timed scenario. Set an objective, brief, staged updates and questions about authority, communications and recovery. In a supplier compromise, ask who suspends payroll access, verifies affected records, approves alternate processing and informs leadership.
Capture decision points, role gaps, missing information and follow-up actions. A tabletop tests coordination and plans; it does not prove controls work or measure likelihood.
Use control validation to verify whether safeguards work
Control validation tests whether a safeguard exists, covers its intended scope and works as expected. Inspect configuration, sample access records, test alerts or observe recovery. Record test scope, evidence date, expected condition and result.
Validate after implementation, evidence of drift or when a decision depends on a safeguard. A pass supports assurance only for the tested scope and time; validation does not discover every threat.
A GRC solution can relate control requirements to evidence and remediation across connected systems. SPOG.AI describes this approach through its GRC solution and continuous control monitoring solution. Teams still choose and interpret the test.
Worked comparison: one supplier risk, two useful outputs
Illustrative scenario: a payroll provider uses an API credential to read and update employee payment details. The organization needs to understand both how the connection could be abused and whether safeguards merit funding. One method cannot fully answer both.
Method
How it examines the same scenario
What it adds
Decision it informs
Threat model
Trace supplier credential → API gateway → payroll records; inspect scopes, token storage, approval boundaries and logs.
Finds a plausible unauthorized-change path and control options such as least privilege, rotation and change alerts.
Which design controls should be implemented before launch?
Scenario analysis
Describe compromise or misuse of the integration followed by altered payment details and a missed payroll run.
Frames impact: delayed payments, reconciliation effort, investigation, employee communications and possible reporting duties.
How material is the exposure, who owns it and what response fits tolerance?
Combine methods only when they answer different questions
A proportionate sequence might threat-model the design, describe business consequences through scenario analysis, use a matrix for triage, quantify only if a loss range could change funding, tabletop response roles and validate safeguards. Not every risk needs every method.
Match timing to the question: model threats before launch or design changes; tabletop a new operating model or post-incident process; use a matrix for routine triage. Reassess when assumptions change, not just when a calendar says to recalculate.
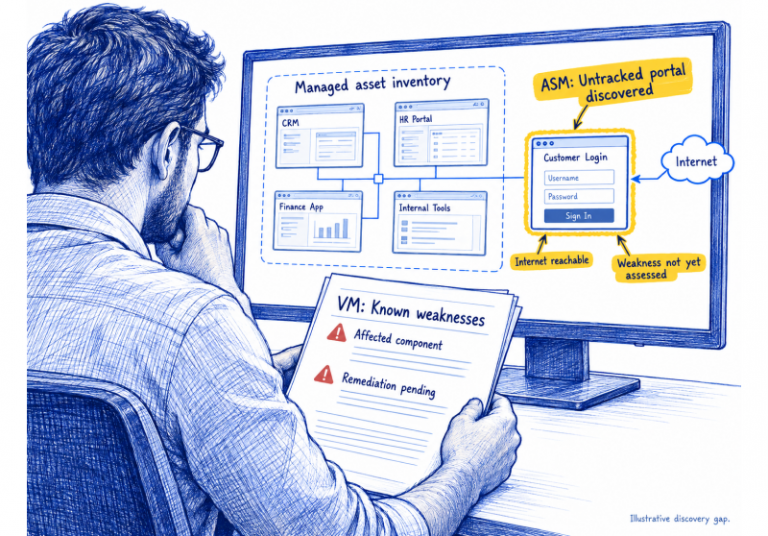
Threat evidence informs but does not settle priority. CISA recommends using the Known Exploited Vulnerabilities catalog as an input; teams must still check local presence, reachability and business importance.
Conclusion: choose the method that answers the decision
Choose cybersecurity risk management techniques to match the uncertainty: model attack paths, explain consequences, triage with a matrix, quantify meaningful loss ranges, test coordination with a tabletop and validate safeguards.
Keep the limits clear: a path is not a probability, a risk band is not a loss estimate and a discussion is not a technical test.
Choose cybersecurity risk management techniques to match the uncertainty: model attack paths, explain consequences, triage with a matrix, quantify meaningful loss ranges, test coordination with a tabletop and validate safeguards.
Structured methods for identifying, analyzing, prioritizing, treating or monitoring uncertainty that could affect business objectives.
Start with the decision and audience. Choose the least complex method that can answer the question with available evidence and usable output.
Threat modeling maps plausible attack paths through a system. Scenario analysis follows an event to business consequences and supports impact-based comparison.
Use a calibrated matrix for consistent first-pass triage across multiple risks. Define likelihood and impact bands and connect each band to an action.
Use it when a defensible loss range could change investment, prioritization, insurance or acceptance decisions. Show assumptions and uncertainty.
It reveals how people make decisions, coordinate, communicate and use plans during a scenario. It does not prove technical controls work.
No. A consistent process can use different methods. Apply each technique where its output adds useful information to the decision.
Set a routine review cadence, then reassess when material changes affect the scenario, assumptions, control state or business impact.
Software can organize evidence, apply defined scoring and route work. People remain responsible for interpreting scenarios and approving risk acceptance.
With 8.5+ years in B2B SaaS, I’ve led demand generation and GTM initiatives across global markets (US, UK, Europe, Africa), helping companies move from fragmented marketing efforts to structured, revenue-focused growth engines.