CBUAE C 1/2026: Monitoring and Testing Cybersecurity Controls
CBUAE C 1/2026 requires Licensed Financial Institutions to regularly monitor and test ICT and cybersecurity risk-mitigating measures. A practical approach is to define what each control is expected to achieve and protect, test its coverage, configuration and operational health, measure results against predefined benchmarks, and connect identified gaps to exceptions, risk and remediation.
The CBUAE Operational Risk Management Regulation C 1/2026 requires Licensed Financial Institutions (LFIs) to undertake regular monitoring and testing of mitigating measures under Article 8.1.3. The broader regulation also requires ICT controls, thresholds and limits to be regularly evaluated and monitored.
Knowing that PAM, EDR, MFA, vulnerability management, backup or other security technologies are deployed does not establish that the controls they support are effective. Regular monitoring and testing needs to determine whether a control has the required coverage, is configured correctly, continues to operate as intended and remains within an acceptable level of performance.
For CIOs and CISOs, the practical challenge is turning this requirement into a repeatable operating process across hundreds of cybersecurity controls. The objective is to establish an evidence-based view of Control Health: is the control providing the level of protection the institution expects?
A practical methodology can be structured into five stages.
1. Establish the Control Objective and Scope
Before a control can be monitored, the institution needs to define what the control is intended to achieve and where it should apply. Together, these form the Control Definition.
Objective describes the outcome the control is expected to achieve. For example, the objective of a PAM control might be: Ensure privileged accounts are identified and appropriately protected through PAM, privileged access is authorised and reviewed, and required privileged-access protections continue to operate as intended.
Scope establishes the population to which the control applies. For PAM, this may include Domain Administrators, local administrators, database administrators, network and firewall administrators, cloud administrators, privileged service accounts and other elevated identities across servers, databases, network devices, security infrastructure and cloud environments.
Getting the scope right is fundamental to meaningful monitoring. If PAM reports 5,000 managed privileged accounts, that number means little unless the institution knows whether 5,000, 5,200 or 8,000 accounts should have been protected.
You cannot measure control effectiveness without first establishing the population the control is expected to protect.
2. Define How the Control Will Be Tested
Once the objective and scope are established, the next step is to determine how control effectiveness will be evaluated.
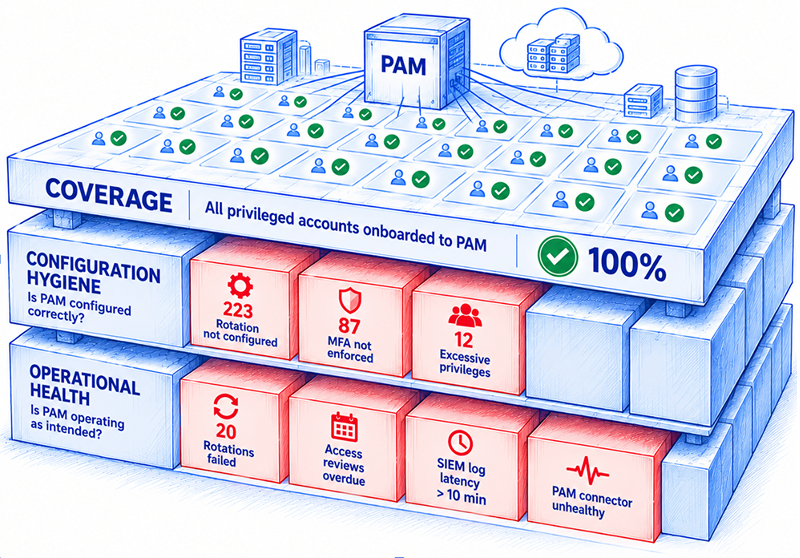
A control such as PAM should not be assessed through a single Pass/Fail test. Multiple tests are needed to establish whether the control has sufficient coverage, is correctly configured and continues to operate effectively.
A control is not effective simply because the technology exists. It is effective when it has the required coverage, is configured correctly and continues to operate as intended.
A practical approach is to classify tests into three Assessment Types:
Assessment Type
Question
Coverage
Is the control applied everywhere it should be?
Configuration Hygiene
Is the control configured according to the required standard?
Operational Health
Is the control continuing to operate as intended?
For PAM, this could translate into:
Assessment Type
Test
Coverage
Percentage of privileged accounts onboarded to PAM
Coverage
Percentage of critical privileged accounts onboarded to PAM
Coverage
Percentage of in-scope privileged systems/assets integrated with PAM
Configuration Hygiene
Percentage of privileged accounts with password rotation correctly configured
Configuration Hygiene
Percentage of privileged access with required MFA policies configured
Configuration Hygiene
Percentage of privileged accounts with access policies configured according to the approved standard
Configuration Hygiene
Percentage of applicable privileged sessions with session recording/monitoring configured
Configuration Hygiene
Percentage of applicable PAM audit logs configured for forwarding to SIEM
Operational Health
Percentage of scheduled password rotations completed successfully
Operational Health
Percentage of privileged-access reviews completed within the required timeframe
Operational Health
Percentage of applicable privileged sessions successfully recorded
Operational Health
Percentage of PAM audit logs received by SIEM within the defined latency threshold
Operational Health
Percentage of PAM components/connectors operating within defined health thresholds
Operational Health
Percentage of unauthorised/failed privileged-access attempts investigated within the defined timeframe
Each test should also define its evidence source, test logic and testing frequency.
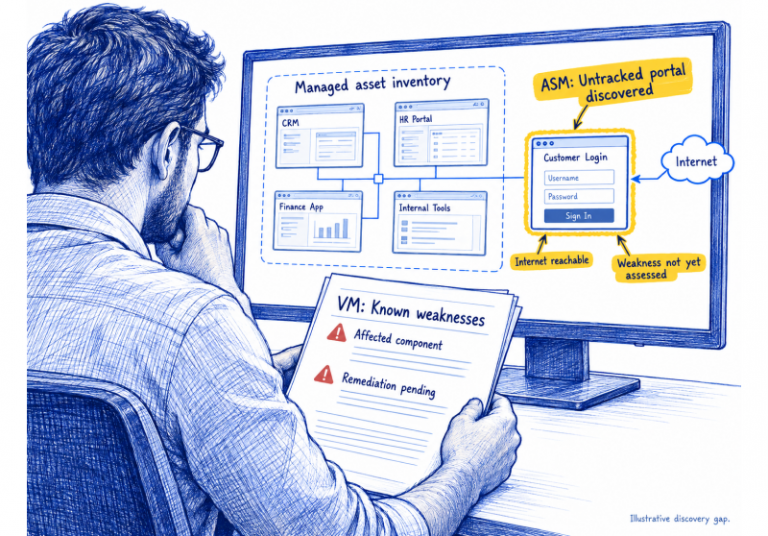
For example, PAM Coverage may require evidence from Active Directory, PAM, IAM and asset inventories. PAM itself can show which accounts are onboarded, but it may not identify privileged accounts that should have been onboarded and are missing.
Testing only the security tool can tell you whether the tool is working. It may not tell you whether the control is complete.
The Evaluation Methodology therefore defines what will be tested, how it will be tested, what evidence will be used and how frequently the test will run.
3. Measure Test Health and Control Health
Once the tests are defined, each needs a consistent scoring methodology.
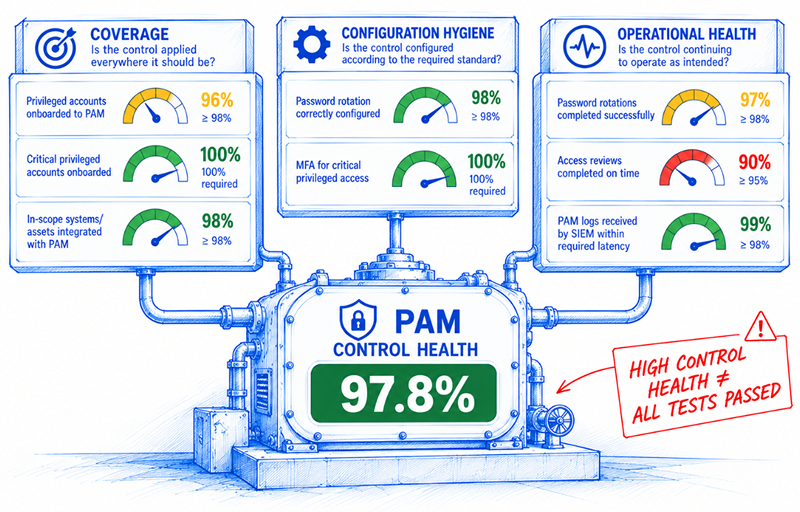
Suppose the PAM Coverage test identifies 1,000 privileged accounts and finds that 960 are onboarded:
Test Health = Privileged Accounts Onboarded ÷ Privileged Accounts Identified × 100
Test Health = 960 ÷ 1,000 × 100 = 96%
Not every test has the same significance to overall control effectiveness. Each test can therefore be assigned a relative weight based on its importance. The weights do not need to total 100 because Control Health can be calculated as a weighted average:
Control Health % = Σ(Test Health % × Test Weight) ÷ Σ(Test Weight)
For example:
Assessment Type
Test
Health
Weight
Coverage
Privileged accounts onboarded to PAM
96%
100
Coverage
Critical privileged accounts onboarded to PAM
100%
100
Coverage
In-scope privileged systems integrated with PAM
98%
80
Configuration Hygiene
Password rotation correctly configured
98%
70
Configuration Hygiene
Critical privileged access with required MFA
100%
100
Configuration Hygiene
Privileged session recording configured
99%
70
Operational Health
Password rotations completed successfully
97%
60
Operational Health
Access reviews completed on time
90%
50
Operational Health
Percentage of PAM audit logs received by SIEM within the defined latency threshold
99%
60
Using these illustrative results, overall PAM Control Health is approximately 97.8%.
The aggregate score gives management a consistent view of overall control health, while the individual tests preserve the detail required to understand exactly where effectiveness is weakening.
The weighting and scoring methodology above is an illustrative implementation approach rather than a CBUAE-prescribed formula. Institutions should determine appropriate scoring based on their control requirements, risk profile and risk appetite.
4. Define What Is Acceptable
A health score becomes useful only when there is a predefined expectation against which it can be assessed.
Each test should therefore have a Minimum Benchmark representing expected performance and thresholds identifying when deterioration becomes significant.
Test
Health
Minimum Benchmark
Critical Threshold
Privileged accounts onboarded to PAM
96%
98%
<95%
Critical privileged accounts onboarded to PAM
100%
100%
<100%
In-scope privileged systems integrated with PAM
98%
98%
<95%
Password rotation correctly configured
98%
98%
<95%
Critical privileged access with required MFA
100%
100%
<100%
Password rotations completed successfully
97%
98%
<95%
Access reviews completed on time
90%
95%
<90%
PAM logs received by SIEM within required latency
99%
98%
<95%
These values are illustrative. Institutions should establish benchmarks, thresholds and weights according to their control requirements, risk profile and risk appetite.
A 96% PAM Coverage result may initially appear healthy. Against a 98% minimum benchmark, however, management can immediately see that the control is operating below expectation.
The methodology therefore answers two different questions: How healthy is the control? And is that level of health acceptable?
This distinction is important. An aggregate score helps management understand overall performance, but it should never hide individual tests that have fallen below acceptable thresholds.
Some Tests Should Be Non-Negotiable
Not every control weakness should be allowed to disappear inside a weighted average.
Institutions may designate certain tests as critical or zero-tolerance requirements because failure represents an unacceptable level of exposure regardless of overall Control Health.
For example, an institution may require 100% of Domain Administrator accounts to be protected through PAM or 100% of critical privileged access to use MFA. If such a requirement fails, the failure should remain visible even if strong performance across other tests produces a high overall Control Health score.
This creates two complementary views:
Control Health provides the aggregate view of effectiveness.
Critical Tests identify requirements that must not be obscured by aggregation.
A control can therefore have a high overall health score while still requiring immediate attention because a critical test has failed.
5. Connect Control Gaps to Exceptions and Risk
Monitoring should distinguish between a technical control gap and a formally accepted exception.
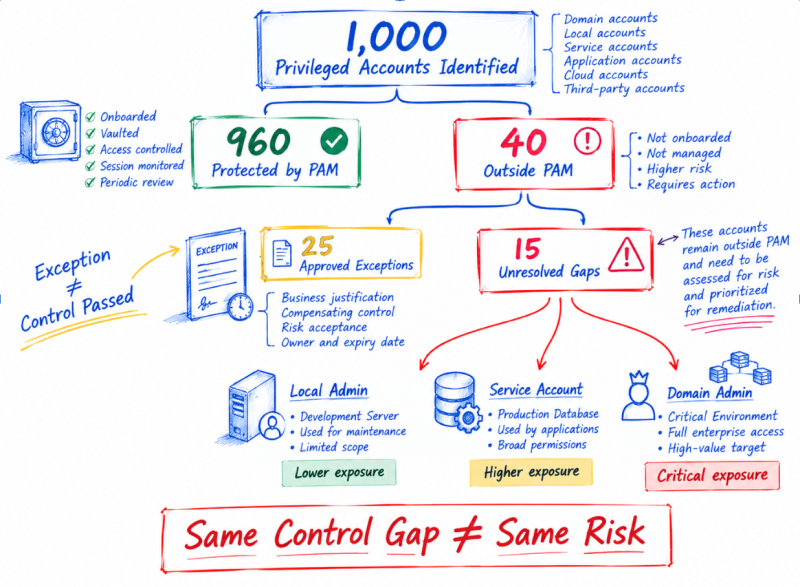
In the PAM example, 1,000 privileged accounts have been identified and 960 are onboarded. That leaves 40 accounts outside PAM.
If 25 of those 40 have valid approved exceptions supported by business justification, compensating controls, risk acceptance and an expiry date, the management view becomes:
An approved exception does not make an account technically covered by PAM. It provides governance and risk context explaining why the deviation has been accepted.
This distinction is important because otherwise accepted exceptions can artificially make a control appear healthier than it actually is.
The unresolved population should then be connected to risk. A local administrator outside PAM on a development system and a Domain Administrator outside PAM are both coverage failures, but they may represent very different exposures.
Privilege level, asset criticality, dependency on Critical Operations, compensating controls and potential impact provide the context required to prioritise remediation.
Regular monitoring can therefore move the management conversation from: “PAM Coverage is 96%.” to: “PAM Coverage is below our 98% benchmark. Twenty-five deviations have approved exceptions, 15 remain unresolved, and the most significant exposures are concentrated in these privileged accounts and critical assets.”
The result is not simply a measurement of control health. It connects control effectiveness to residual risk and action.
From Periodic Assessment to Continuous Control Monitoring
The same methodology can be applied across PAM, IAM, EDR, vulnerability management, patching, backup, network security, cloud security and other cybersecurity controls.
The operating model remains consistent:
Risk → Control Definition → Tests → Evidence → Test Health → Control Health → Exceptions & Risk → Remediation
The tests and evidence change from one control to another, but the underlying methodology does not.
An EDR control might test endpoint coverage, policy configuration and agent health. A backup control might test workload coverage, backup configuration, successful backup execution and recovery testing. A vulnerability-management control might test asset coverage, authenticated scanning, scan freshness, remediation performance and SLA compliance.
This provides a common assurance methodology rather than requiring a different monitoring approach for every security technology.
More importantly, it changes the question from “Do we have control?” to: Is the control providing the level of protection we expect?”
Operationalizing the Model With SPOG.AI
Applying this methodology to one control is manageable. Applying it consistently across hundreds of controls, thousands of assets and multiple technology platforms requires connected evidence and automation.
SPOG.AI operationalizes the model by allowing organisations to define the Control Objective and Scope, configure multiple tests across Coverage, Configuration Hygiene and Operational Health, connect those tests to authoritative evidence sources, and establish scoring, weights, benchmarks and thresholds.
Test results roll up into Control Health, while critical test failures remain visible rather than being hidden by aggregation. Exceptions, affected assets, associated risks and remediation remain connected to the underlying result.
This creates a connected assurance chain from the regulatory requirement to the operational evidence demonstrating how effectively the underlying control is working.
For CIOs and CISOs, it provides a consistent answer to six questions:
What should the control achieve? What should it protect? How is it being tested? Is it operating effectively? Where is it below expectation? What risk remains?
The Bottom Line
CBUAE C 1/2026 requires regular monitoring and testing of mitigating measures. Meeting that expectation should go beyond confirming that cybersecurity technologies have been deployed.
The more useful question is whether each control has the required coverage, correct configuration and operational effectiveness, whether its performance remains within defined expectations, and whether identified gaps are being appropriately accepted or remediated.
The operating discipline is straightforward:
Define the Control → Test It → Measure Health → Compare Against Expectations → Manage Exceptions & Risk → Remediate
This turns regular monitoring and testing from a periodic compliance exercise into a repeatable, evidence-driven process for answering a much more important question:
Are our cybersecurity controls actually providing the protection we expect?
Founder & CEO at SPOG.AI | Cyber Risk Intelligence | Continuous Security Assurance | AI & Cybersecurity Leadership
Sumit Malhotra is the founder of SPOG.AI, a cybersecurity mesh platform purpose-built to unify risk visibility, automate compliance, and drive continuous security maturity across complex enterprise environments. With over 24 years of experience across cybersecurity, GRC, IT operations, and infrastructure strategy, Sumit has partnered with organizations to solve some of the most persistent challenges in security operations: fragmented tooling, audit fatigue, delayed risk decisions, and lack of ownership alignment.